
Apple Ads Keyword Popularity Is Recovering
US keywords with SAP above 5 have been rising sharply since October 23, 2026. Daily figures and a comparison with the level before the drop.
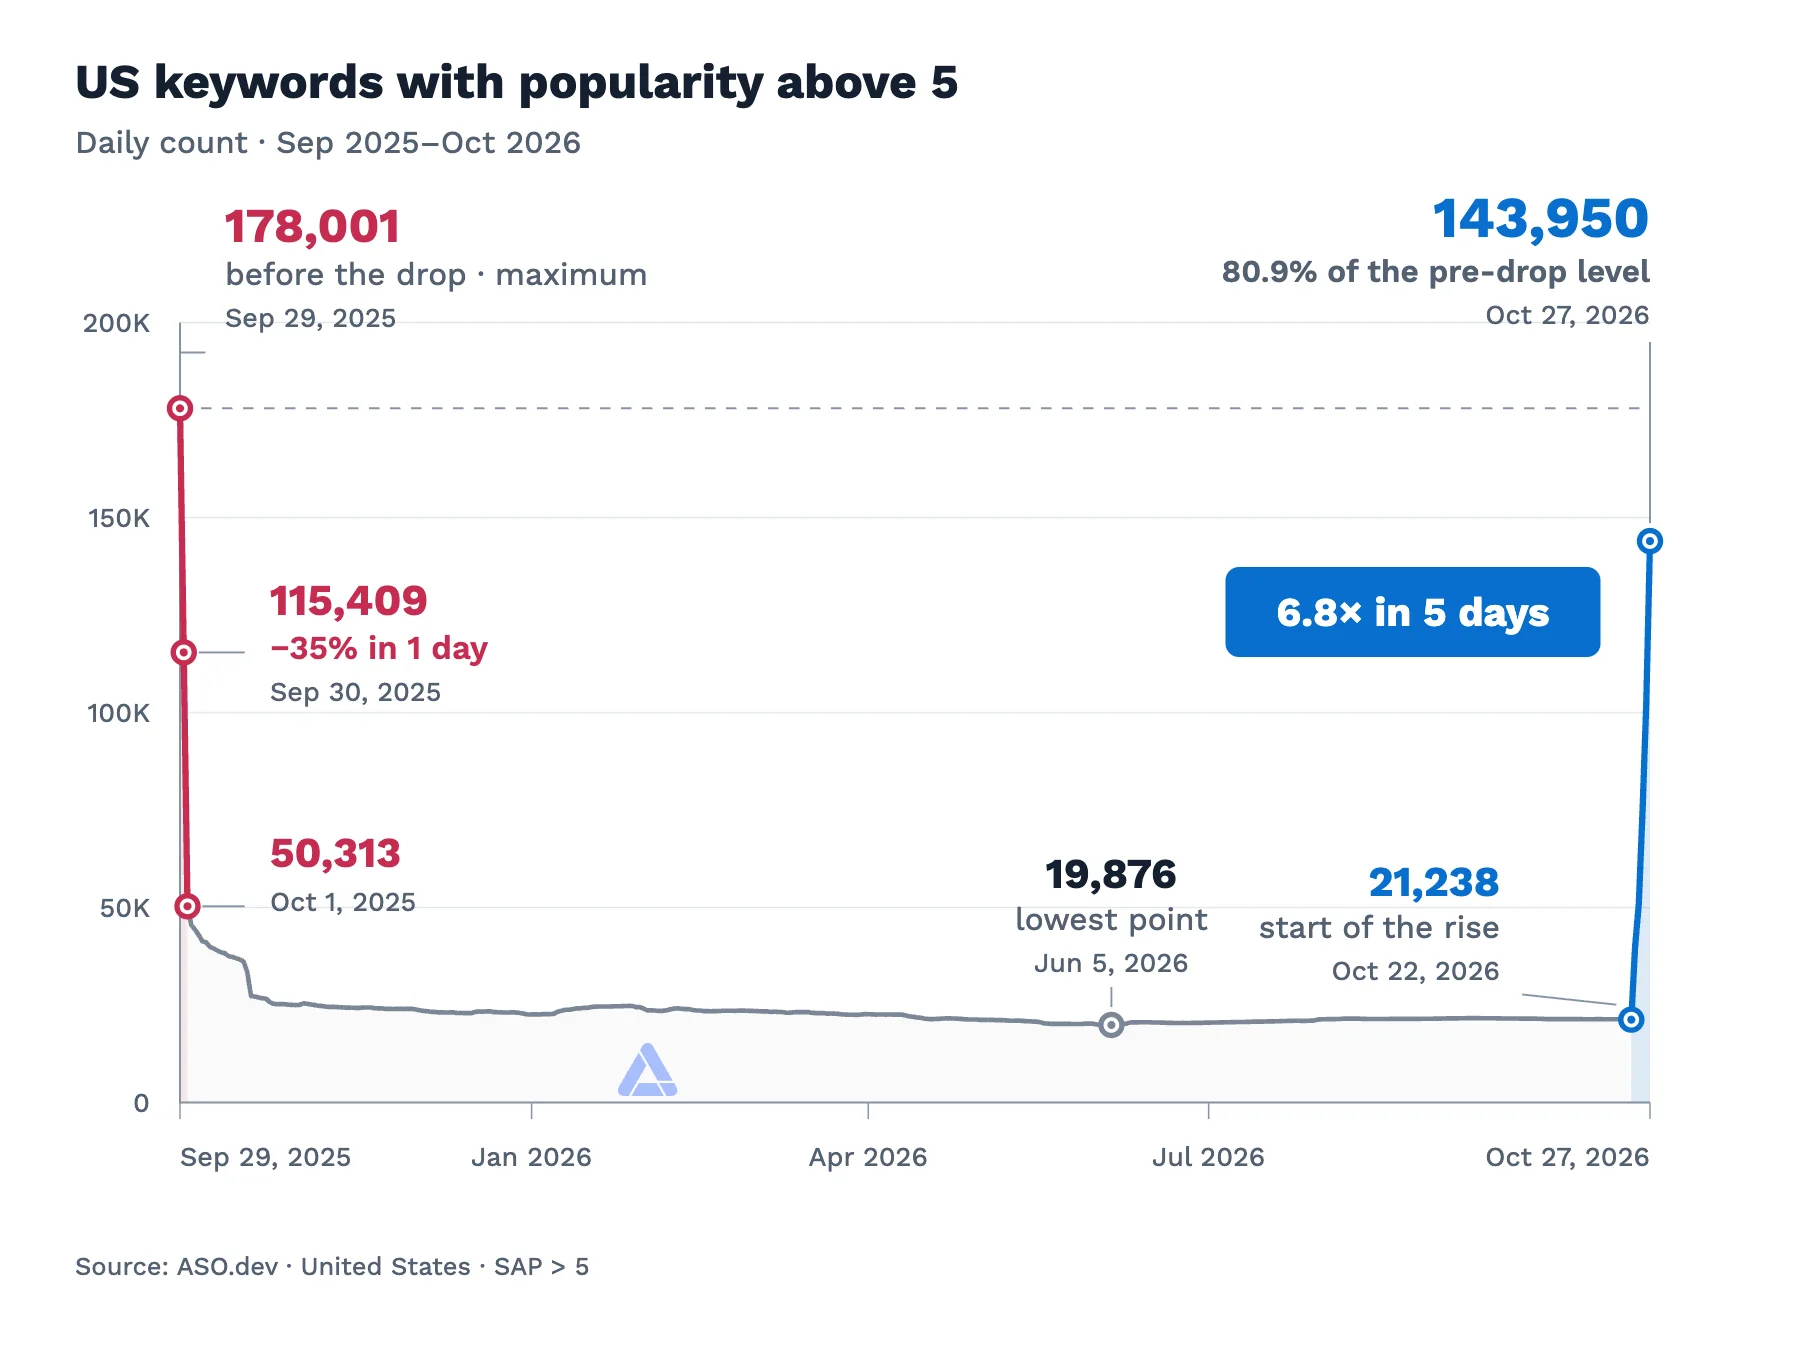
The chart and article tables count US keywords with SAP above 5. The full period from September 29, 2025 to October 27, 2026 uses one continuous calendar scale.
In our first article on the Apple Ads popularity drop, we described how many keywords started returning SAP 5 in autumn 2025. In late October 2026, US statistics began moving in the opposite direction: the number of keywords with popularity above 5 is rising rapidly.
The first sharp increase appears on October 23, 2026. By October 27, the count reached 143,950, almost 6.8 times the level on October 22, immediately before the rise.
Daily Figures from the First Day
Section titled “Daily Figures from the First Day”On October 22, 2026, the US statistics contained 21,238 keywords with SAP above 5. The next day added 18,560. The count continued rising throughout all five recovery days available in the new export.
| Date | SAP > 5 | Added | Daily growth |
|---|---|---|---|
| Oct 22 | 21,238 | Start | — |
| Oct 23 | 39,798 | +18,560 | +87.4% |
| Oct 24 | 50,875 | +11,077 | +27.8% |
| Oct 25 | 74,657 | +23,782 | +46.7% |
| Oct 26 | 102,384 | +27,727 | +37.1% |
| Oct 27 | 143,950 | +41,566 | +40.6% |
Between October 22 and 27, the number of keywords above the threshold of 5 increased by 122,712, or 577.8%. The largest absolute daily increase during these five days occurred on October 27: 41,566 additional keywords.
We are counting keywords whose SAP exceeds 5. The percentages in the table describe changes in that count, rather than increases in each keyword’s popularity score.
How Close Is the Earlier Level?
Section titled “How Close Is the Earlier Level?”The same export contains 178,001 keywords with SAP above 5 for September 29, 2025. By October 27, 2026, the count was approaching that level, but recovery differs across ranges.
| SAP range | September 29, 2025 | October 27, 2026 |
|---|---|---|
| 6–9 | 4,693 | 941 |
| 10–19 | 71,619 | 10,146 |
| 20–39 | 88,856 | 109,092 |
| 40–59 | 11,874 | 21,739 |
| 60–84 | 930 | 1,989 |
| 85–100 | 29 | 43 |
| Total above 5 | 178,001 | 143,950 |
Every range from 20 upwards now contains more keywords than at the selected historical point. The 6–9 and 10–19 ranges remain substantially smaller. The total is approaching the earlier count, while the distribution has yet to match the pattern before the drop.
The 20–39 range contributed most to the last five days of growth: its count rose from 1,895 to 109,092 between October 22 and 27. That accounts for 107,197 of the total increase of 122,712 keywords.
What This Tells Us About Popularity
Section titled “What This Tells Us About Popularity”The latest figures show a widespread increase in the number of keywords with SAP above 5. The distribution statistics alone cannot establish the cause. We are still monitoring whether Apple’s earlier values have recovered fully and consistently.
SAP is a relative measure of keyword popularity. An increase in the number of keywords above a threshold does not itself establish a matching increase in search traffic, installs, or app rankings. Learn more about Search Ads popularity and Apple’s definition of the relative indicator in the Apple Ads glossary.
The observation in this article concerns the United States. Other countries need to be assessed using their own histories.
Which Data ASO.dev Displays
Section titled “Which Data ASO.dev Displays”ASO.dev continues to display averaged popularity for now. The latest value is also available. We are monitoring the situation and the stability of the new data.
The Search Ads popularity history lets you compare new and earlier values for a particular keyword and country. You can follow the overall distribution in the popularity detector.
The recovery is already clear in the daily counts. We are watching whether the rise continues and how consistently individual keyword values update.
Data Source
Section titled “Data Source”Daily ASO.dev statistics for the United States, covering September 11, 2024 to October 27, 2026, with 777 consecutive daily records. Article prepared on October 28, 2026.
The count of keywords with SAP above 5 is the sum of the 6–9, 10–19, 20–39, 40–59, 60–84, and 85–100 ranges. The source export’s total for SAP 10 and above excludes 6–9, so we add that range to retain the threshold used in the first article.