App Analytics Dashboard: Downloads, Revenue & Retention
This section allow you to analyze your app’s performance data, helping you optimize your app and improve its visibility in the App Store.
These insights enable developers to make informed decisions and optimize their app for better visibility and success in the App Store.
To access your app’s metrics, you need to provide an App-Specific Password.
Getting Started
Section titled “Getting Started”To access your app’s metrics in ASO.dev, you need to use an App-Specific Password. An App-Specific Password allows you to securely connect to your App Store Connect account and access your app’s data.
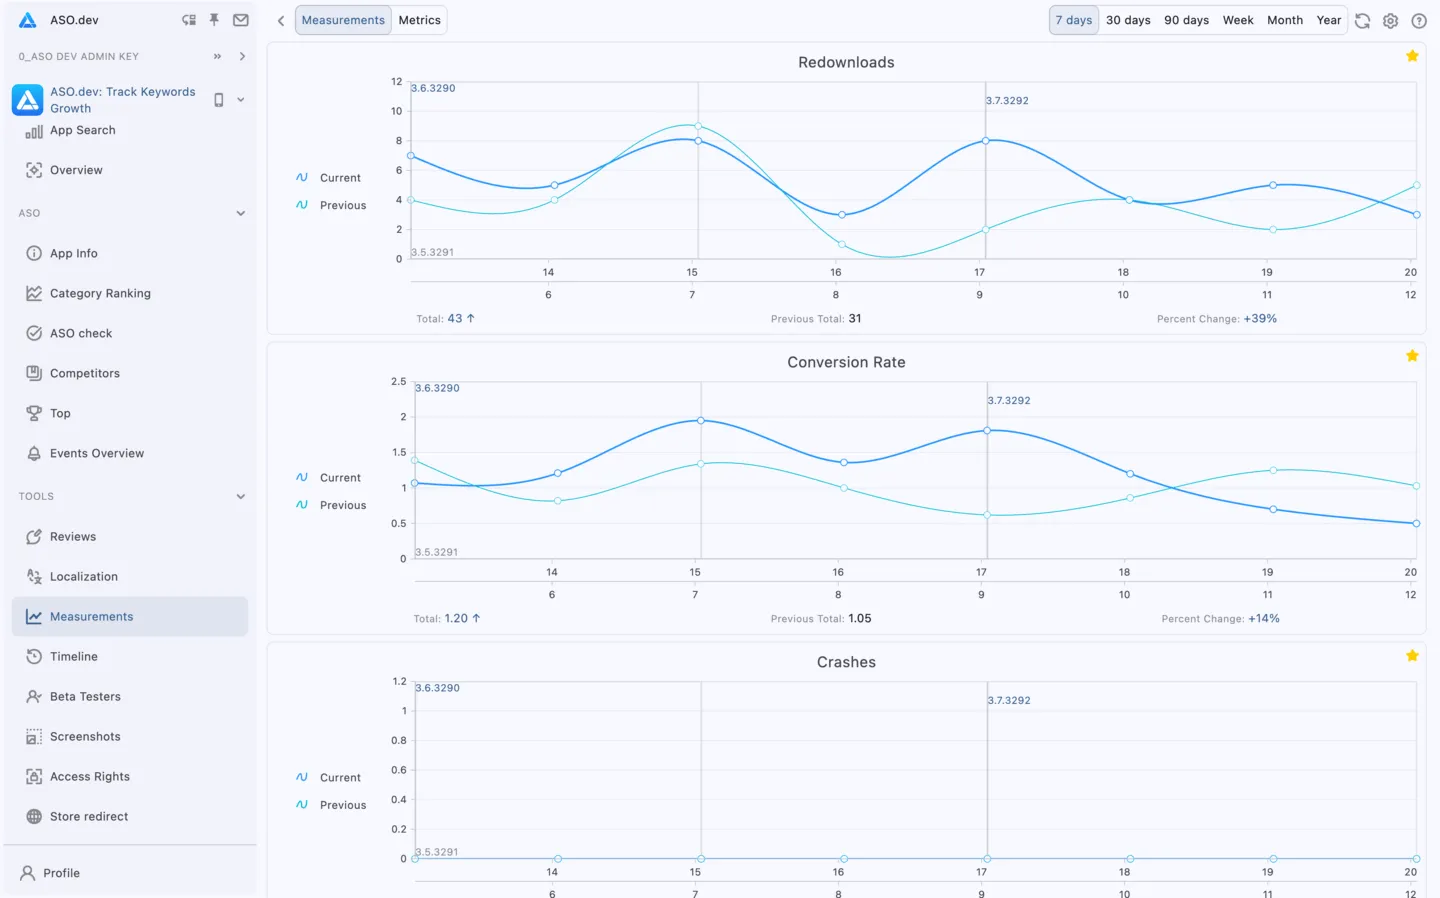
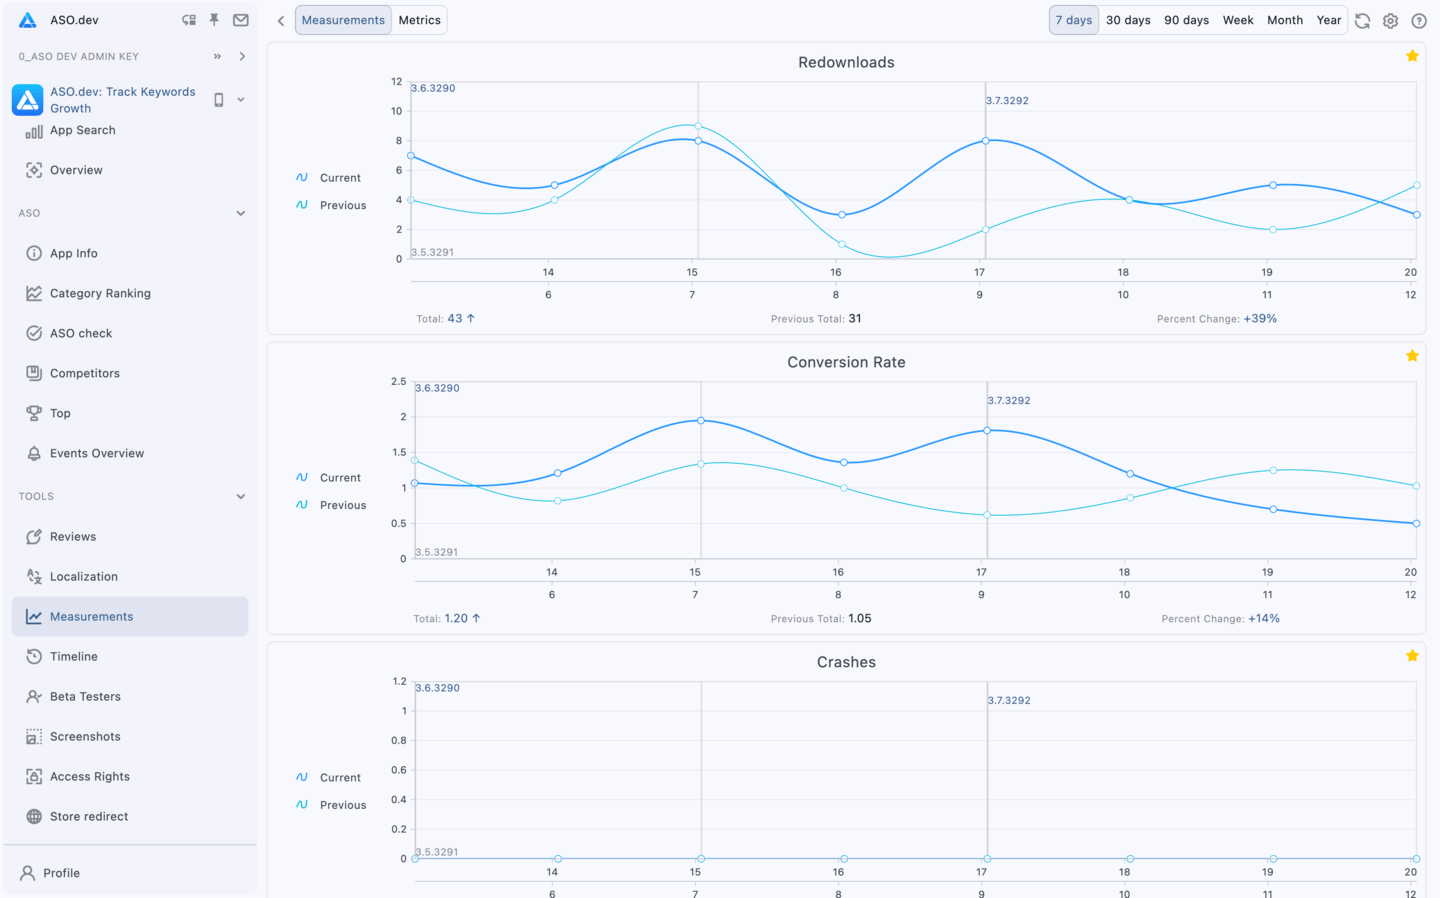
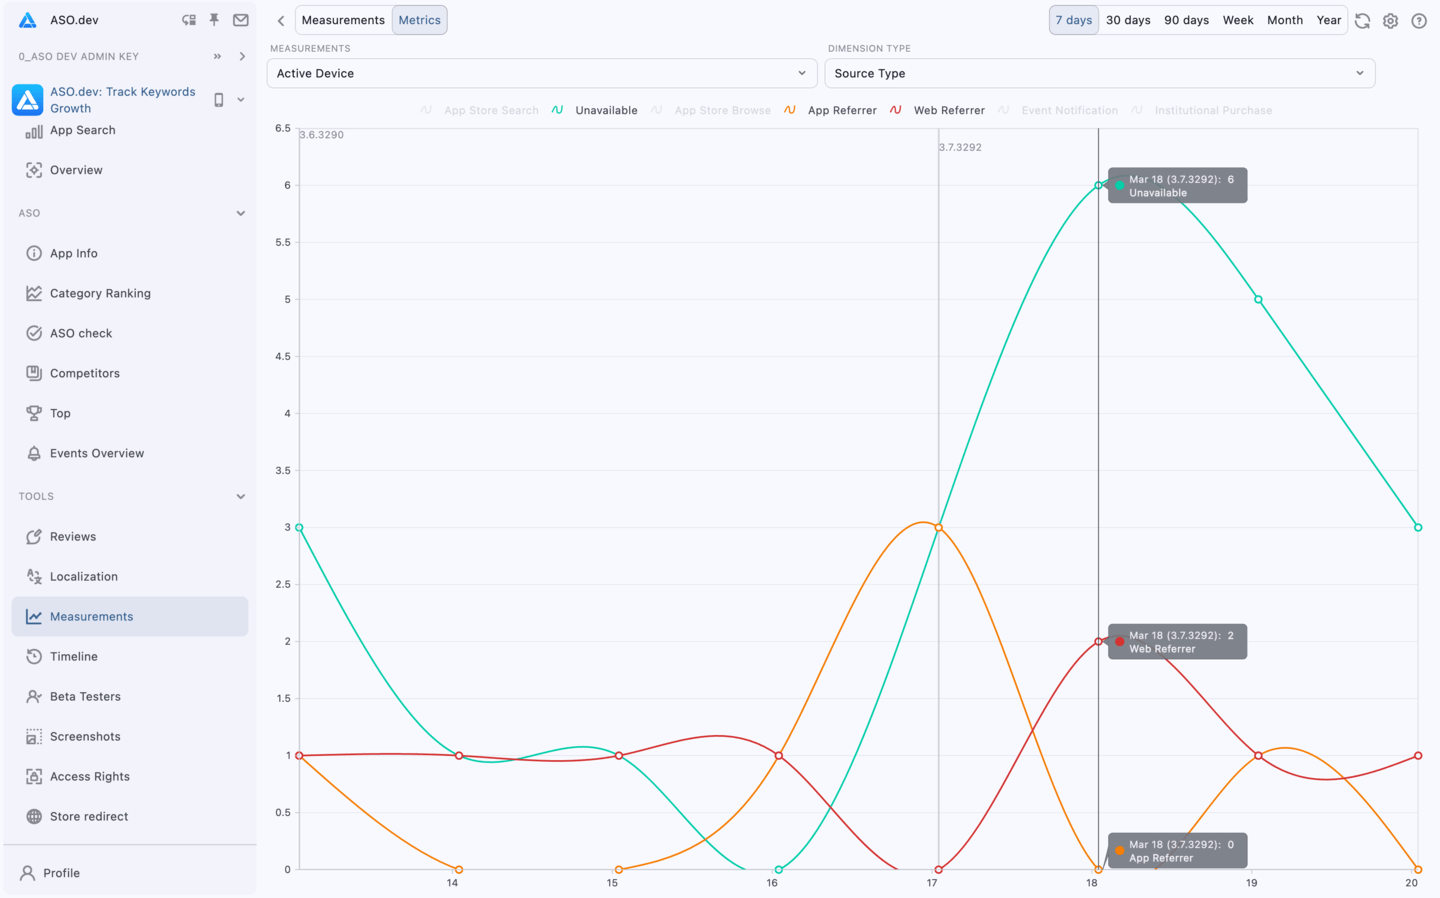
In the metrics section, you can pin the most important metrics for you so that they are always at hand. To do this, simply click on the star icon next to the desired metric.
Vertical lines on the graph represent app release dates.
You can select the desired period to see how metrics have changed over time:
- 7 days
- 30 days
- 90 days
- Week
- Month
- Year
Two graphs will be displayed on the chart - one for the current period and another for the previous period, providing a clear comparison.
Below the chart, you will see the current value, the previous value, and the percentage change for each metric.
Metrics with increasing values are highlighted in blue, while those with decreasing values are shown in red for easy interpretation.
Metrics
Section titled “Metrics”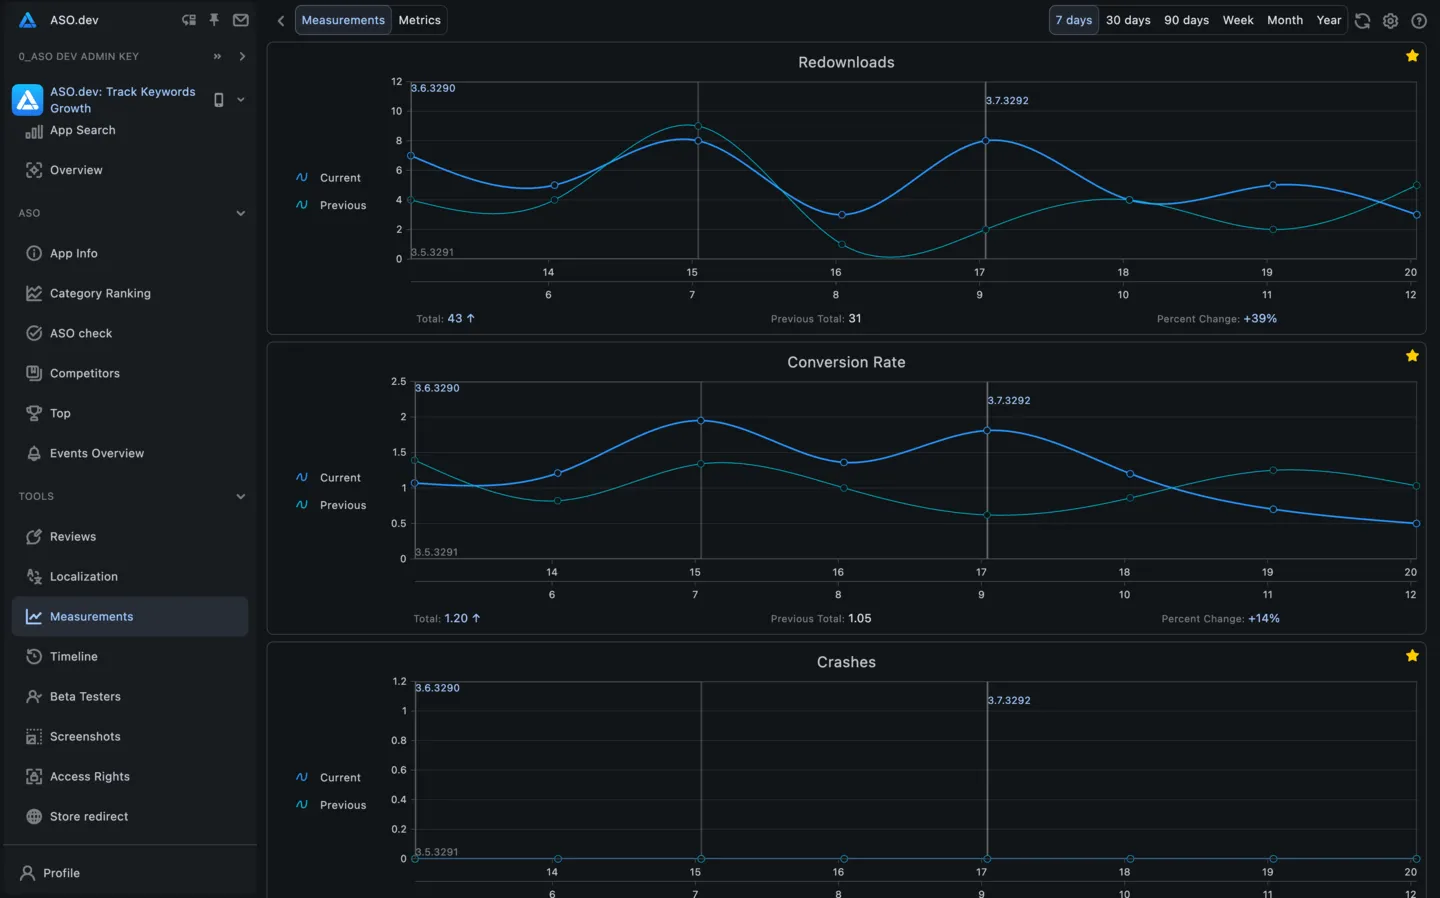

- Impressions - The number of times your app was displayed in the App Store, including search results, featured stories, and other categories. This metric helps evaluate the effectiveness of your app’s icon and its ability to attract user attention.
- Unique Impressions - The number of unique users who viewed your app.
- Sessions on Active Devices - The number of app launches on unique devices, providing insights into how frequently users interact with your app.
- Updates - The number of app updates installed by users.
- Sales - The total amount of sales before deducting Apple’s commission.
- Revenue - The actual income earned by the developer after deducting commissions.
- Product Page Views - The number of times users opened your app’s page, helping you assess the effectiveness of your app’s title, description, screenshots, and videos.
- Unique Product Page Views - The number of unique users who opened your app’s page.
- Active Devices - The number of unique devices that interacted with the app.
- All Downloads - The total number of installations, including reinstalls.
- First Downloads - The number of new unique users who downloaded the app for the first time, helping you measure the success of your app’s marketing and advertising efforts.
- Reinstalls - The number of times users re-downloaded an app that was previously installed.
- Installs - The total number of app installations, including reinstalls.
- Uninstalls - The number of times users removed the app from their devices.
- In-App Purchases - The number of units sold for products, including apps, in-app purchases, and subscriptions, providing insights into user engagement and their willingness to spend money on your app.
- Active Devices - Unique devices that had at least one session during the selected period, helping track your app’s user base and overall reach.
- Paid Users - The number of users who purchased a paid subscription.
- Crashes - The number of recorded app crashes.
- Conversion Rate - The percentage of users who installed the app after viewing its page.
Measurements
Section titled “Measurements”
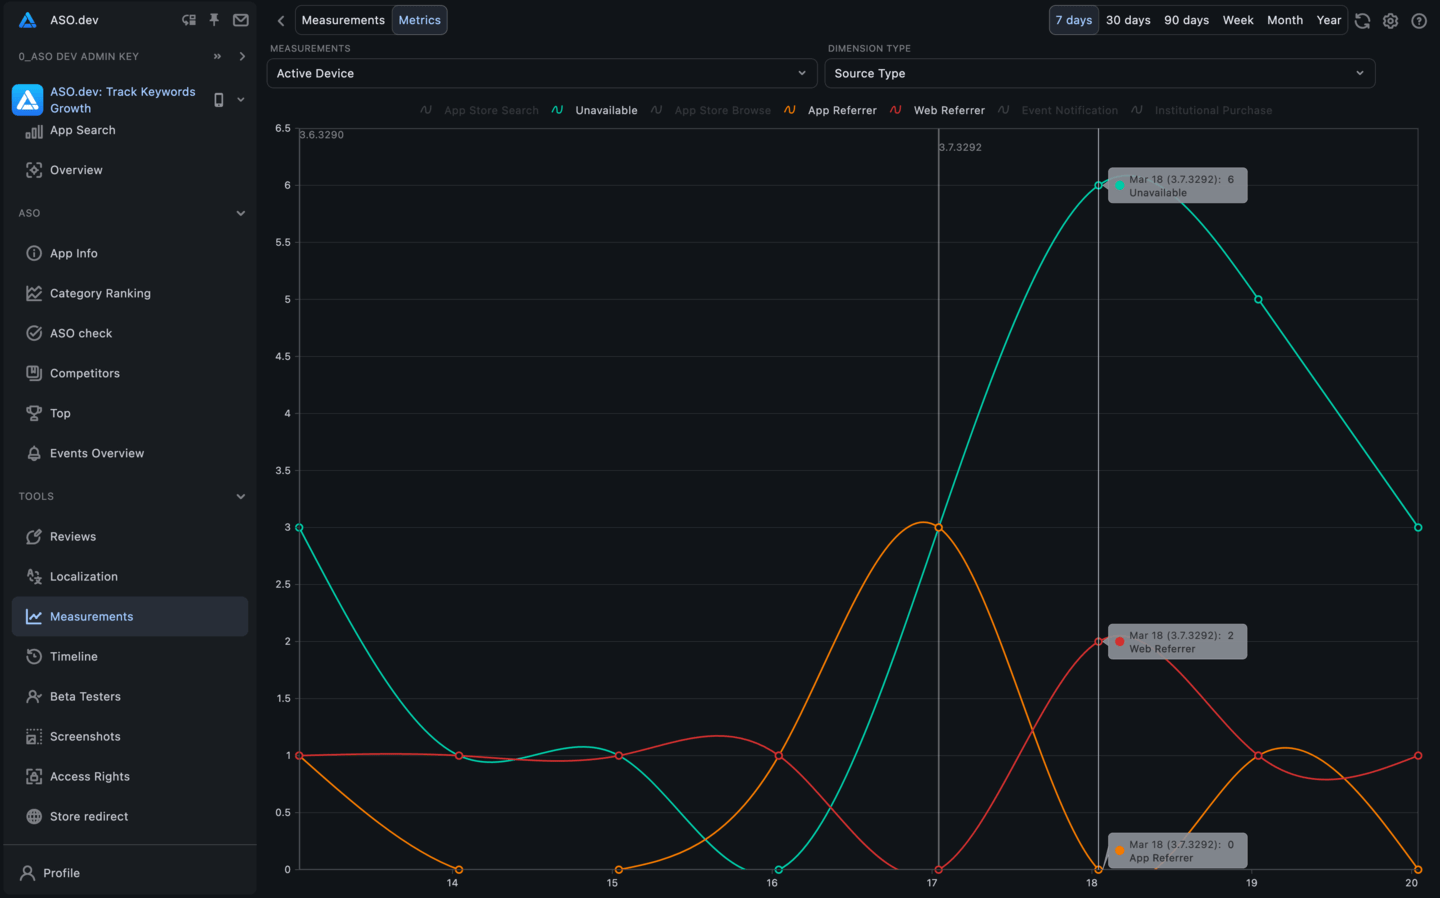

Metrics - the same as in the previous section.
Measurement Types:
- App Version: Analyze user behavior and performance metrics for specific app versions, helping you understand the impact of updates and releases.
- Device: Segment data by device types (e.g., iPhone, iPad, Mac) to identify user behavior patterns and optimize the app experience for different devices.
- Platform Version: Track metrics based on operating system versions (e.g., iOS 16, iOS 17) to analyze compatibility and leverage new OS features effectively.
- Page Type: Understand which App Store page users originated from - main, Custom Product Page, Search Ads, etc., to optimize user acquisition strategies.
- Region: Group data by broad geographical categories (e.g., North America, Europe) for macro-level analysis and regional trends.
- Territory: Dive deeper into specific countries or regions (e.g., USA, France, Japan) for precise insights and localized strategies.
- Source Type: Identify user acquisition sources, such as App Store search, link clicks, advertising campaigns, or external traffic, to refine marketing efforts.
- Application Link: Determine if users arrived via another app (e.g., deeplinks or ad links within partner apps) to evaluate cross-app promotion effectiveness.
- Campaign: Segment data by marketing campaigns (e.g., StoreKit or Apple Search Ads parameters) to measure the success of specific advertising initiatives.
- In-App Event: Analyze traffic generated by App Store Events - promotional events displayed in the App Store - to assess their impact on user engagement.
- In-App Purchase: Evaluate the performance of specific in-app purchases promoted on the app’s page to optimize monetization strategies and product promotions.
Create an App-Specific Password
Section titled “Create an App-Specific Password”We recommend creating a new Separate Apple Account with specific access to your primary account.
This allows you to limit access and enhance the security of your data.
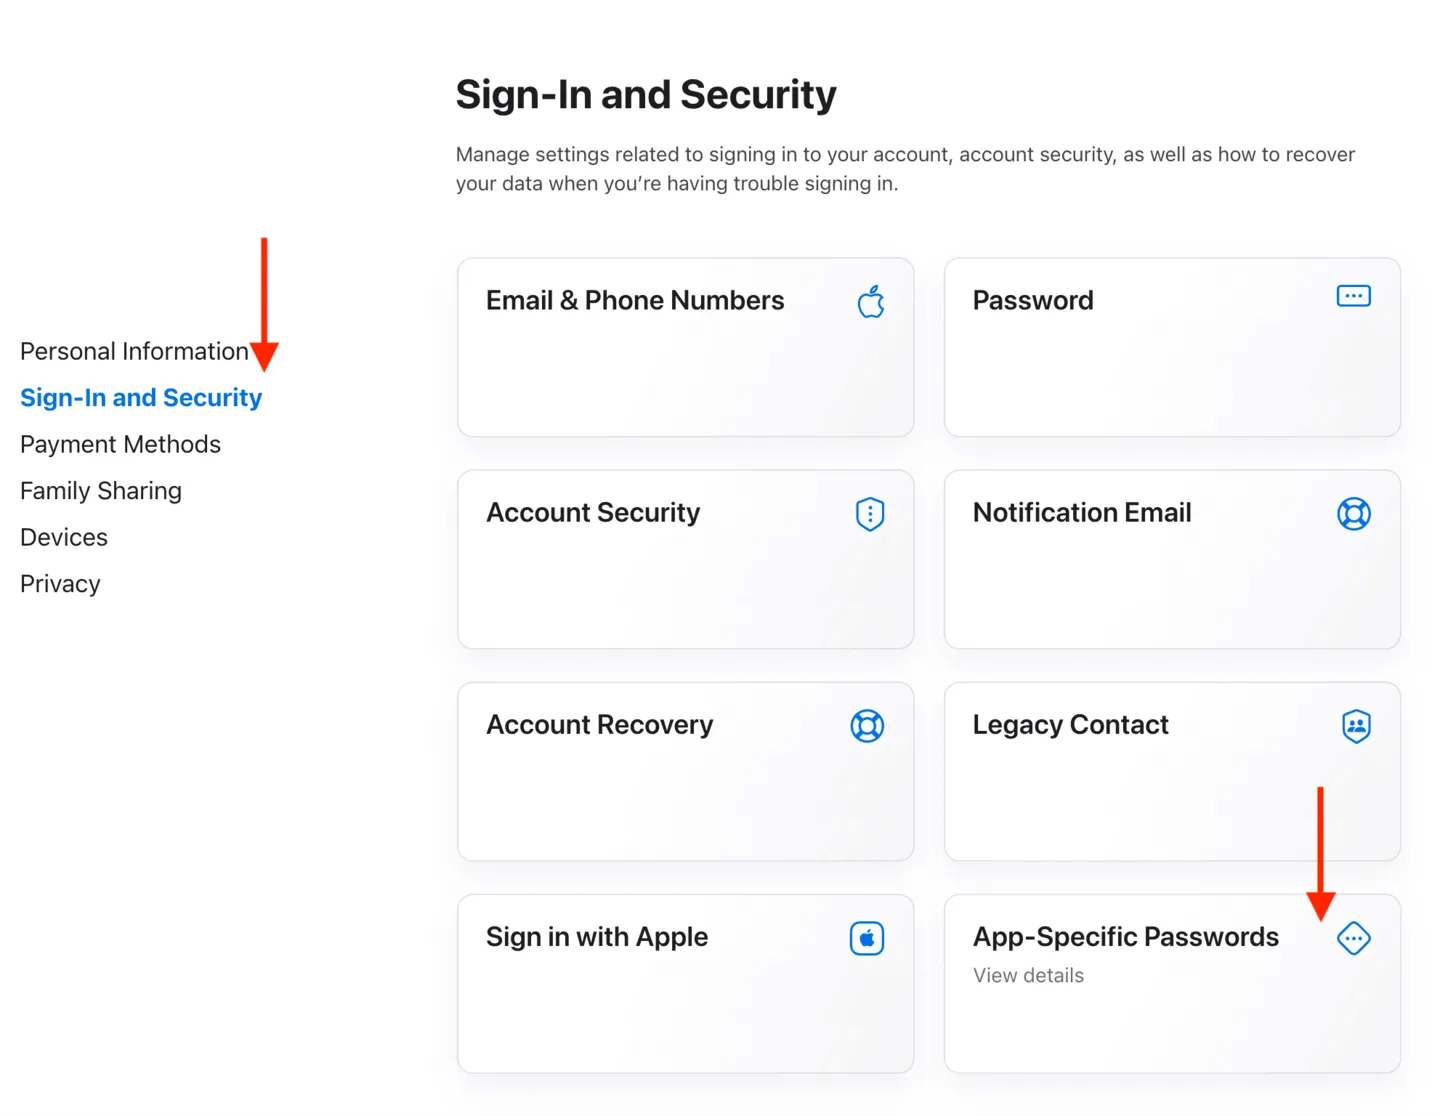
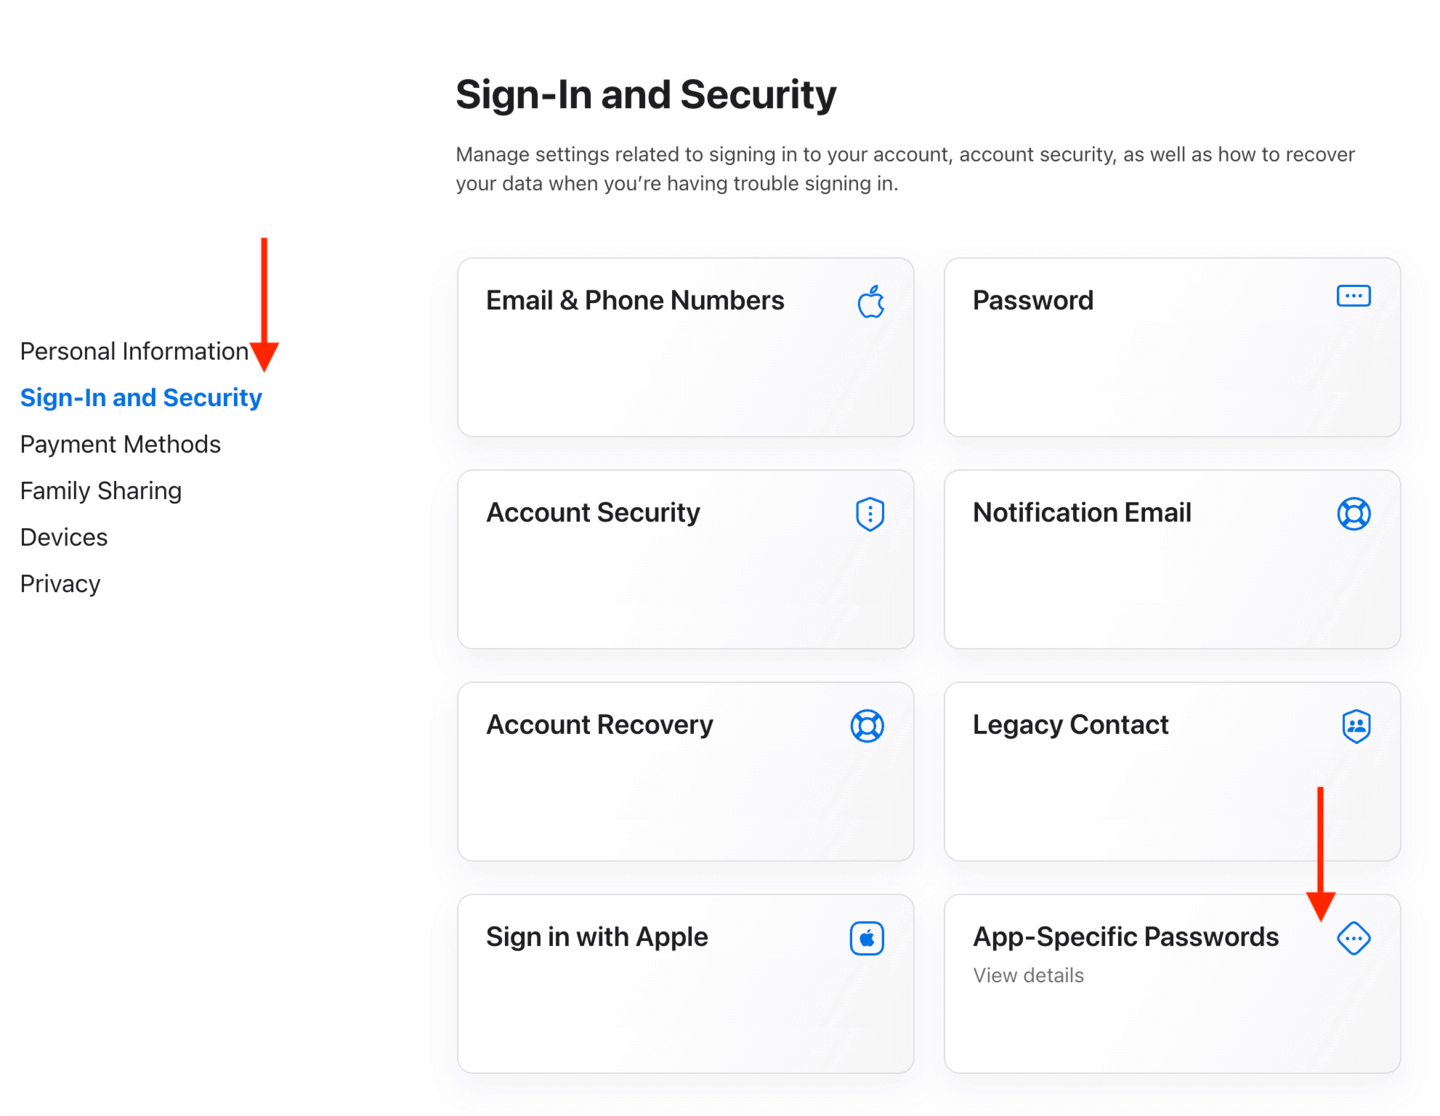
Sign in to Your Apple Account with your email and password.
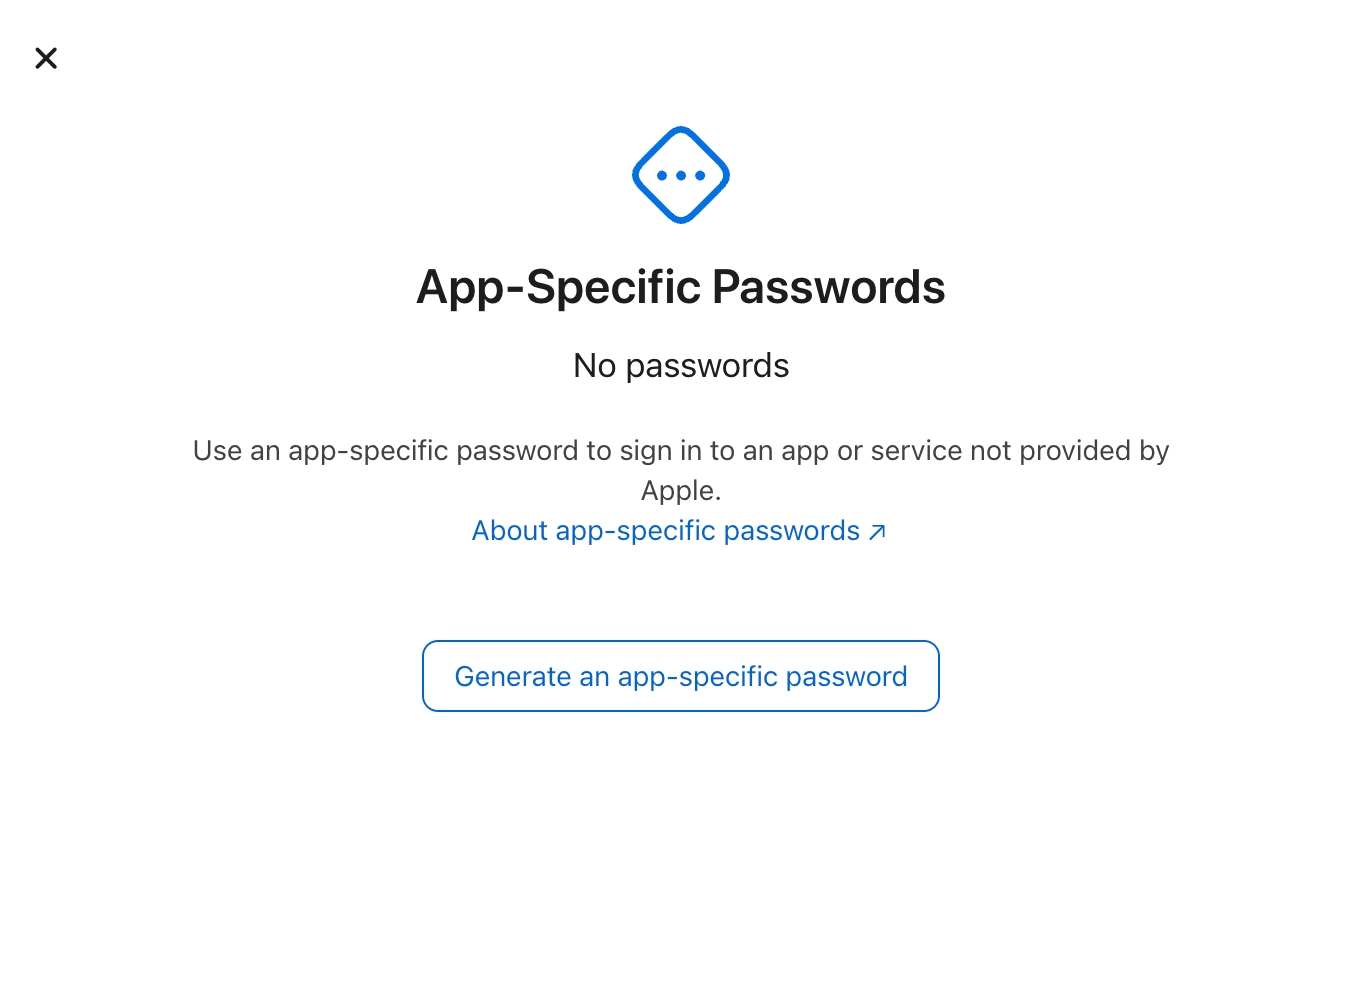
Once signed in, in the “Sign-In and Security” section, select “App-Specific Passwords”.
Select Generate an app-specific password or select the + Add button.
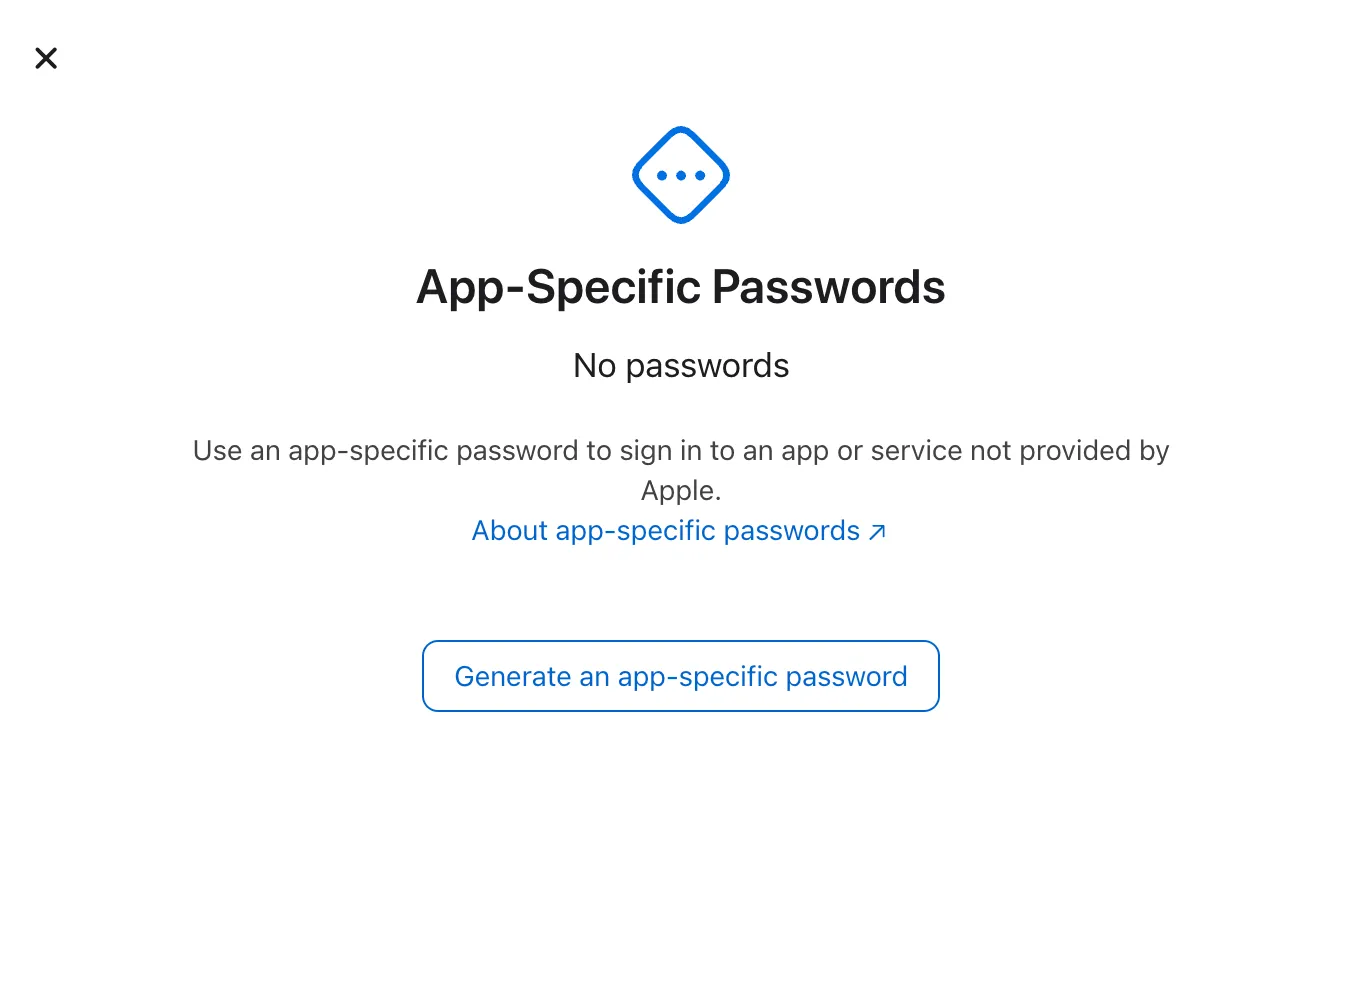
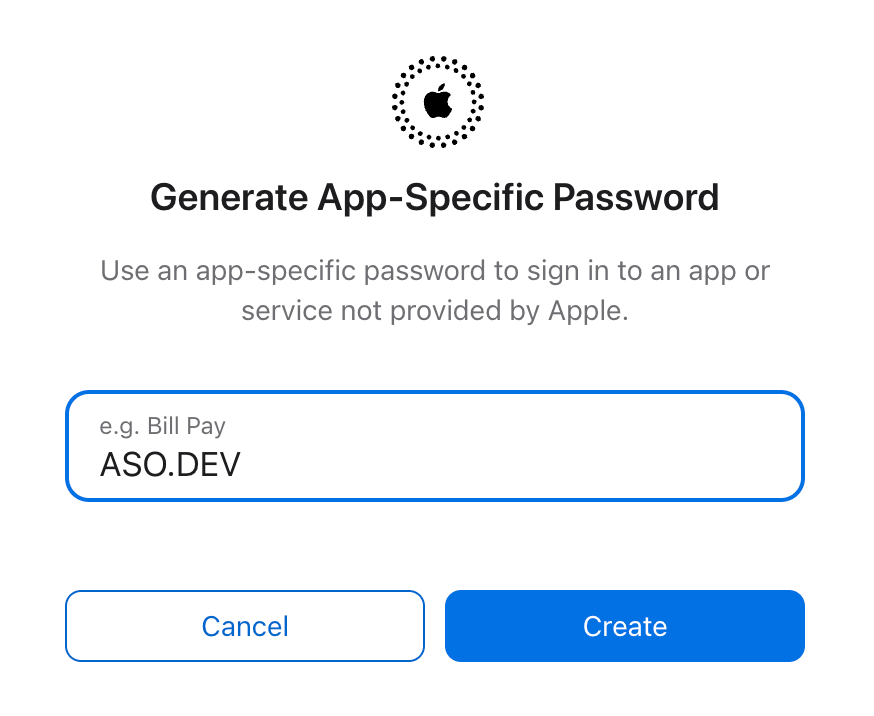
Enter a Label for the Password to help you remember its purpose, then click “Create”.

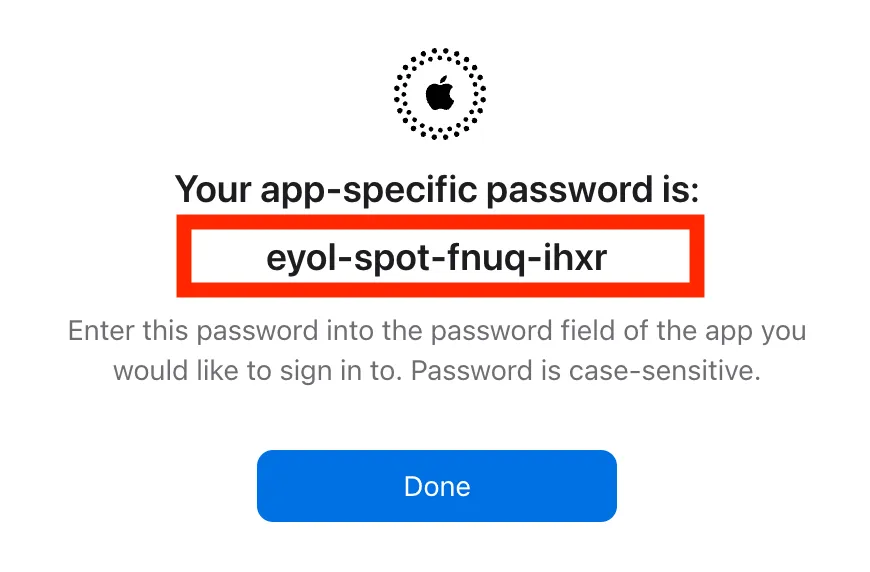
Copy and save the generated password in a secure place. This password will only be displayed once.
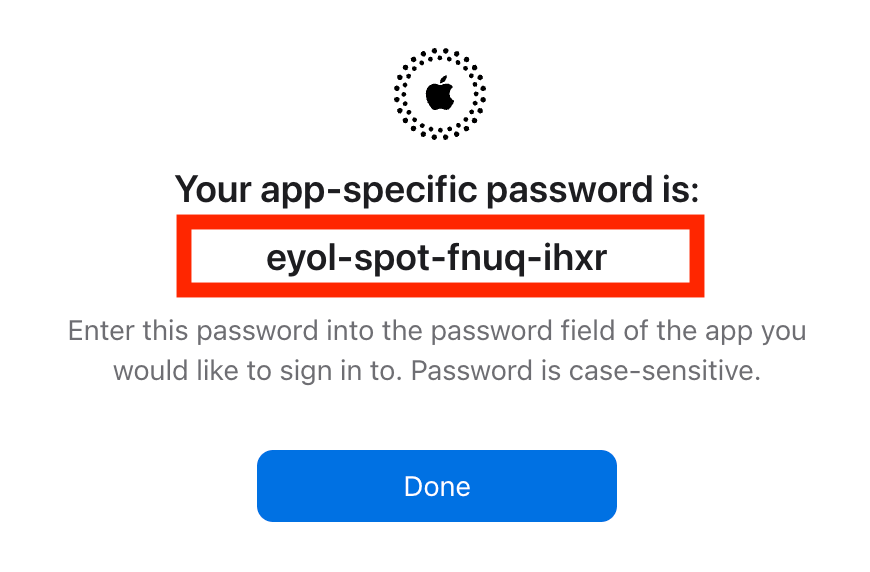
Use the generated password to sign in to the third-party app or service that requested access to Your Apple Account. Instead of entering Your primary Apple Account password, enter the App-Specific Password.
You can have up to 25 active app-specific passwords. If you need to, you can revoke passwords individually or all at once.