SAP Anomaly Detector: Search Ads Popularity Shifts
SAP Distribution History Over Time
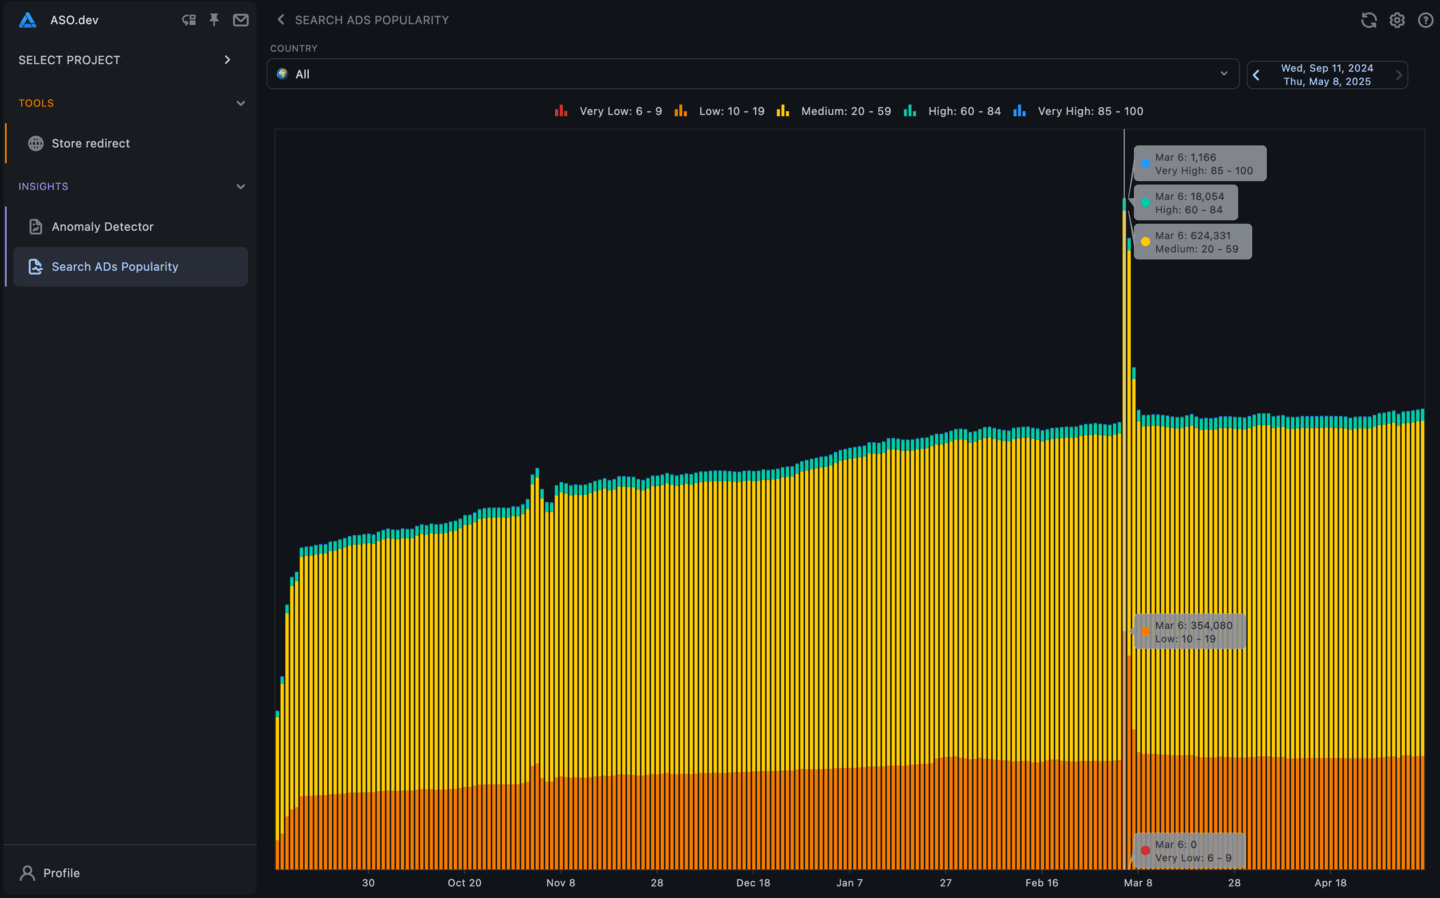
Section titled “SAP Distribution History Over Time”The SAP (Search Ads Popularity) distribution history provides insights into how keyword popularity evolves over time. This analysis helps identify trends, shifts in user behavior, and potential algorithm changes in the App Store.


Popularity Ranges
Section titled “Popularity Ranges”- Very High (85 - 100): Extremely high search volume, maximum competition.
When to use:- For brand names or top-level generic keywords.
- Ideal for strong brands or apps with high budgets and conversion rates.
- Risky for small apps unless highly relevant.
- High (60 - 84): High traffic, but also high competition; best suited for well-known apps with sufficient resources for promotion.
When to use:- For apps with established user bases.
- Requires competitive budgets and strong marketing strategies.
- Ideal for boosting visibility in competitive categories. When to use:
- For scaling campaigns.
- Requires stronger creatives and good App Store page optimization.
- Best if you can handle mid-to-high CPI (cost per install).
- Medium (20 - 59): Moderate search volume with a decent balance of traffic and competition, suitable for steady app growth.
When to use:- Main zone for growth-stage apps.
- Reliable for sustainable downloads with controlled budgets.
- Good starting point for long-term keyword strategies.
- Low (6 - 19): Small search volume, but better than very low. Suitable for niche keywords with less competition but lower traffic.
When to use:- Good for initial keyword expansion.
- Catch small but targeted audiences.
- Use when competition is too tough for bigger keywords.
- Very low (0 - 5): Extremely low search volume.
When to use:- For highly niche keywords; experiments; very low-budget campaigns.
Key Observations
Section titled “Key Observations”- Fluctuations in Popularity: Over time, keywords may shift between ranges due to seasonality, user interest, or App Store algorithm updates.
- Emerging Trends: Monitoring low-popularity keywords can help identify emerging trends before they become competitive.
- Algorithm Adjustments: Sudden shifts in the distribution of keywords across ranges may indicate changes in the App Store’s ranking algorithm.
Chart Insights
Section titled “Chart Insights”The chart visualizes the distribution of keywords across these popularity ranges over time, enabling you to:
Detect trends in keyword competitiveness.
Identify potential anomalies or irregularities in keyword rankings.
Adjust ASO strategies based on observed changes in keyword popularity.
The A marker (means Anomaly) in red highlights potential irregularities or significant deviations in popularity, suggesting possible App Store algorithm changes.
The X marker (means not relevant) in gray notes periods where data may have been impacted by aso.dev algorithm changes or external factors.
By analyzing SAP distribution history, you can stay ahead of market trends and optimize their app’s visibility in the App Store.