App Store Ratings History: Chart and Daily Table
For memberships with access to the ASO analysis: Indie, Pro and Marketing
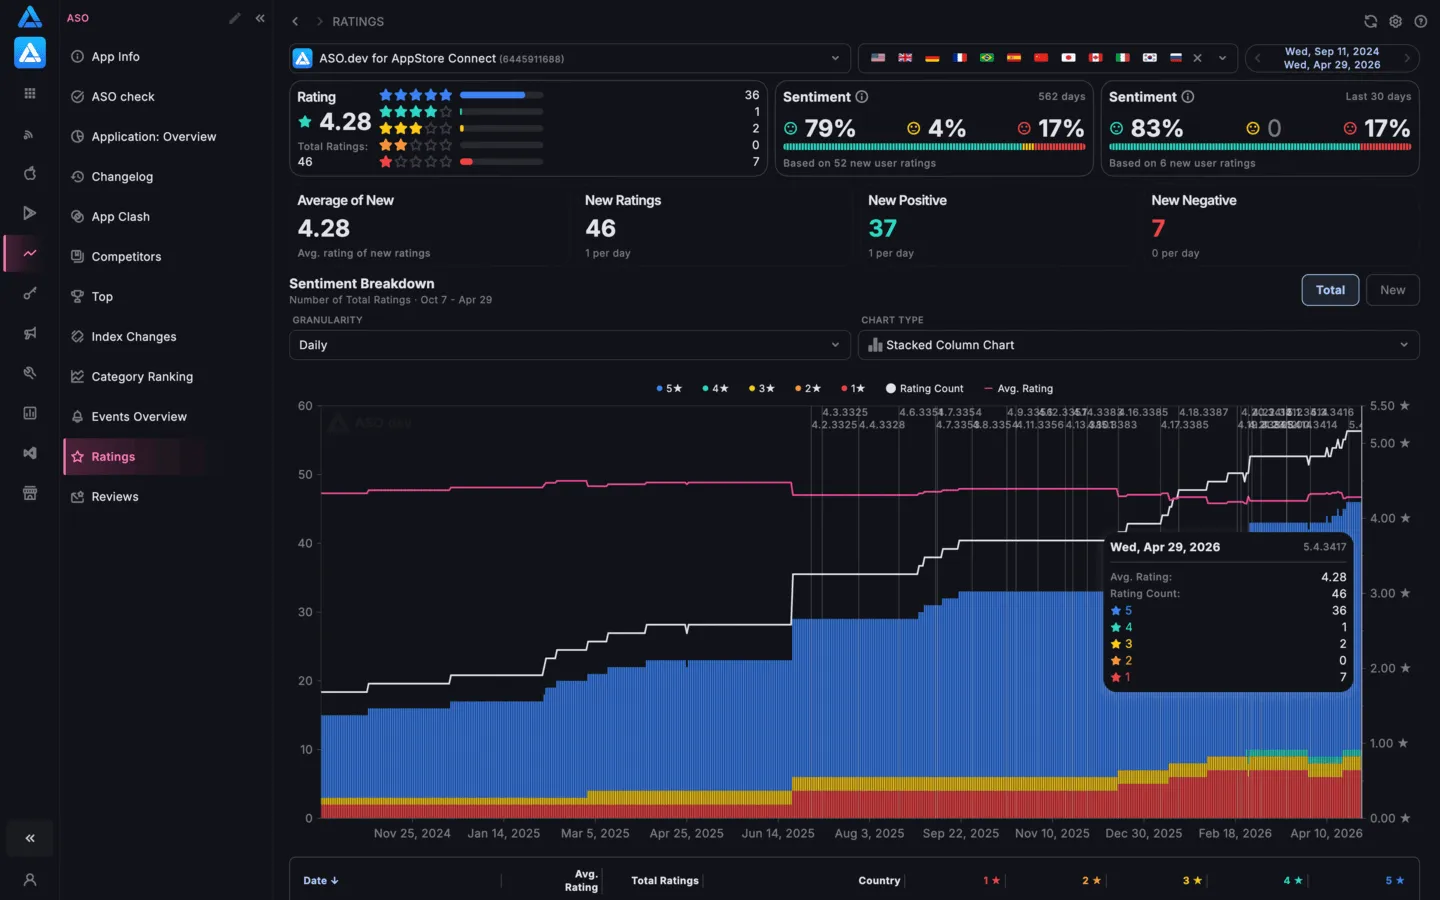
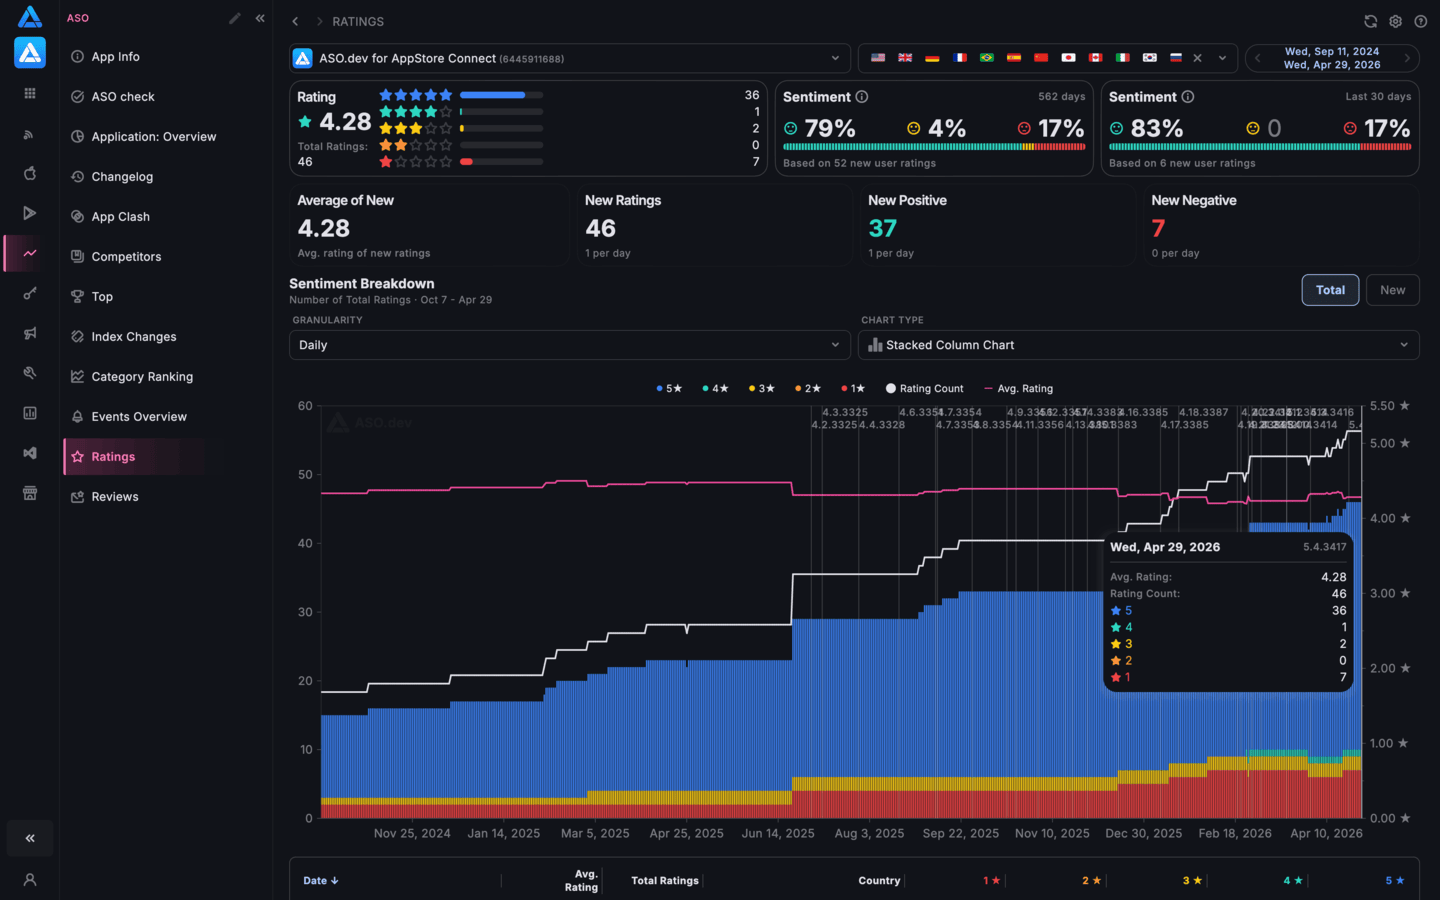
The Ratings section shows the rating history of a selected app in the App Store. You can see how many ratings the app receives over time, how the average rating changes, and which star ratings users leave most often.
What the Chart Shows
Section titled “What the Chart Shows”The chart shows rating dynamics for the selected period. You can view total ratings or only new ratings by day, week, or month.
The chart includes:
- total number of app ratings
- new ratings for the selected period
- average app rating
- star distribution: 1★, 2★, 3★, 4★, 5★
- positive and negative changes, including removed ratings
History for the last 30 days for the Indie membership
For the Pro and Marketing memberships without date restrictions
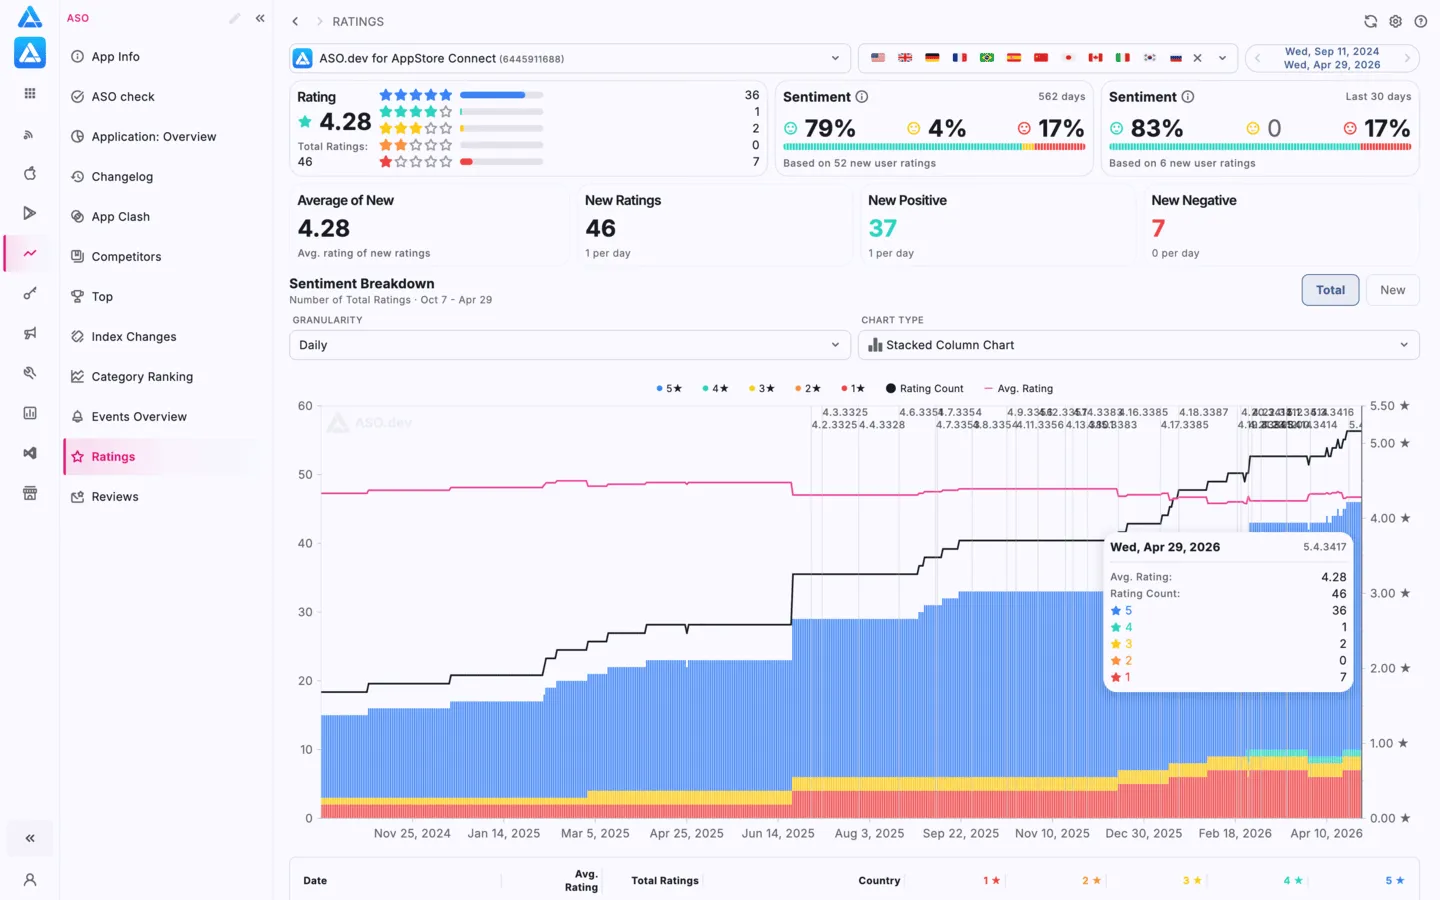
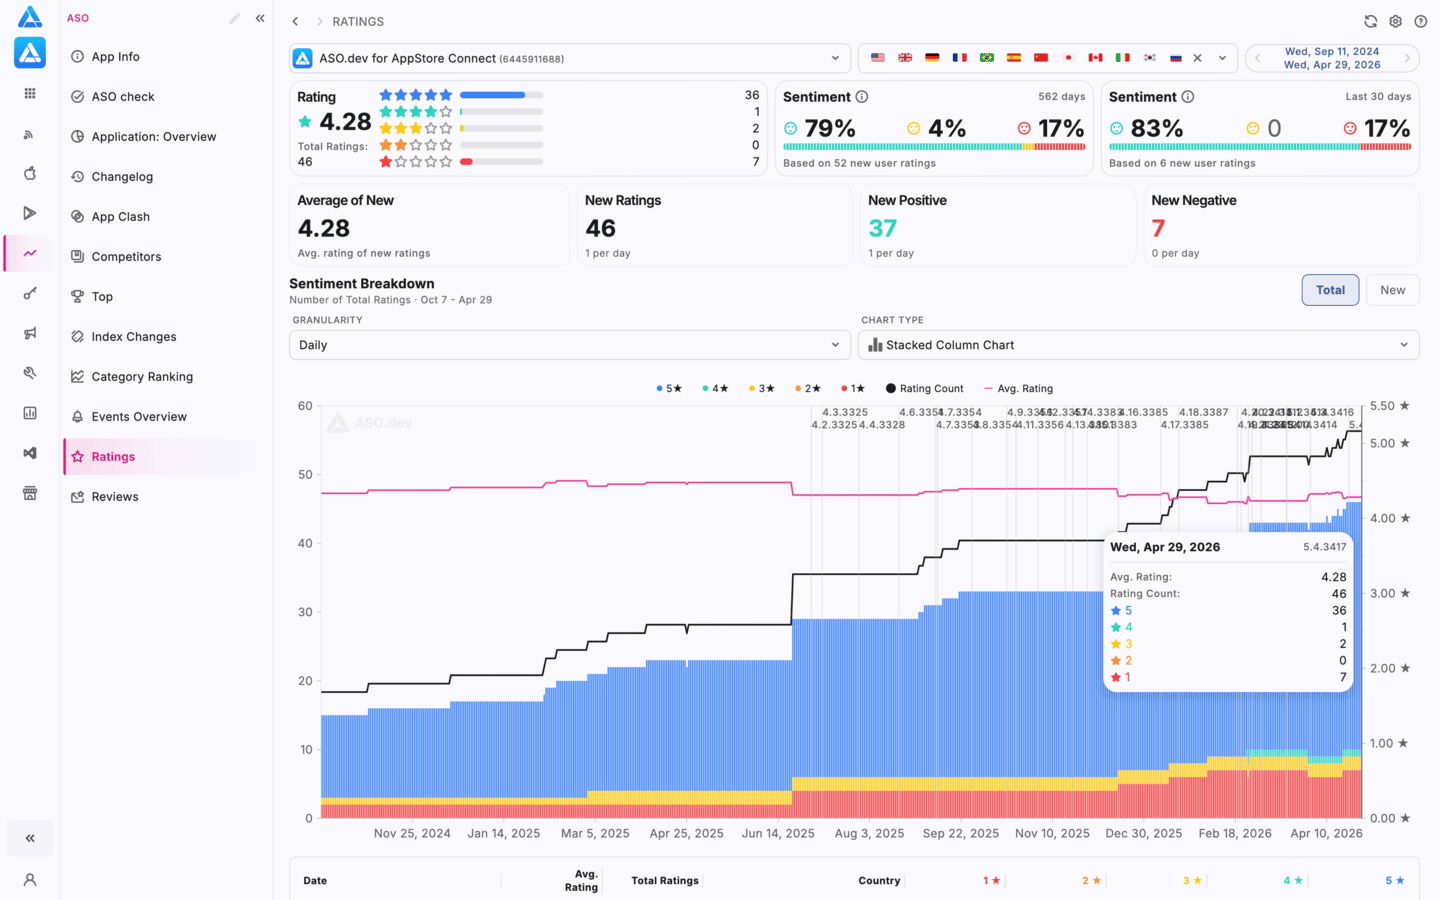
Ratings Table
Section titled “Ratings Table”Below the chart, the table breaks the data down by date. It helps you check when the app received new ratings, which country they came from, and how the star distribution changed.
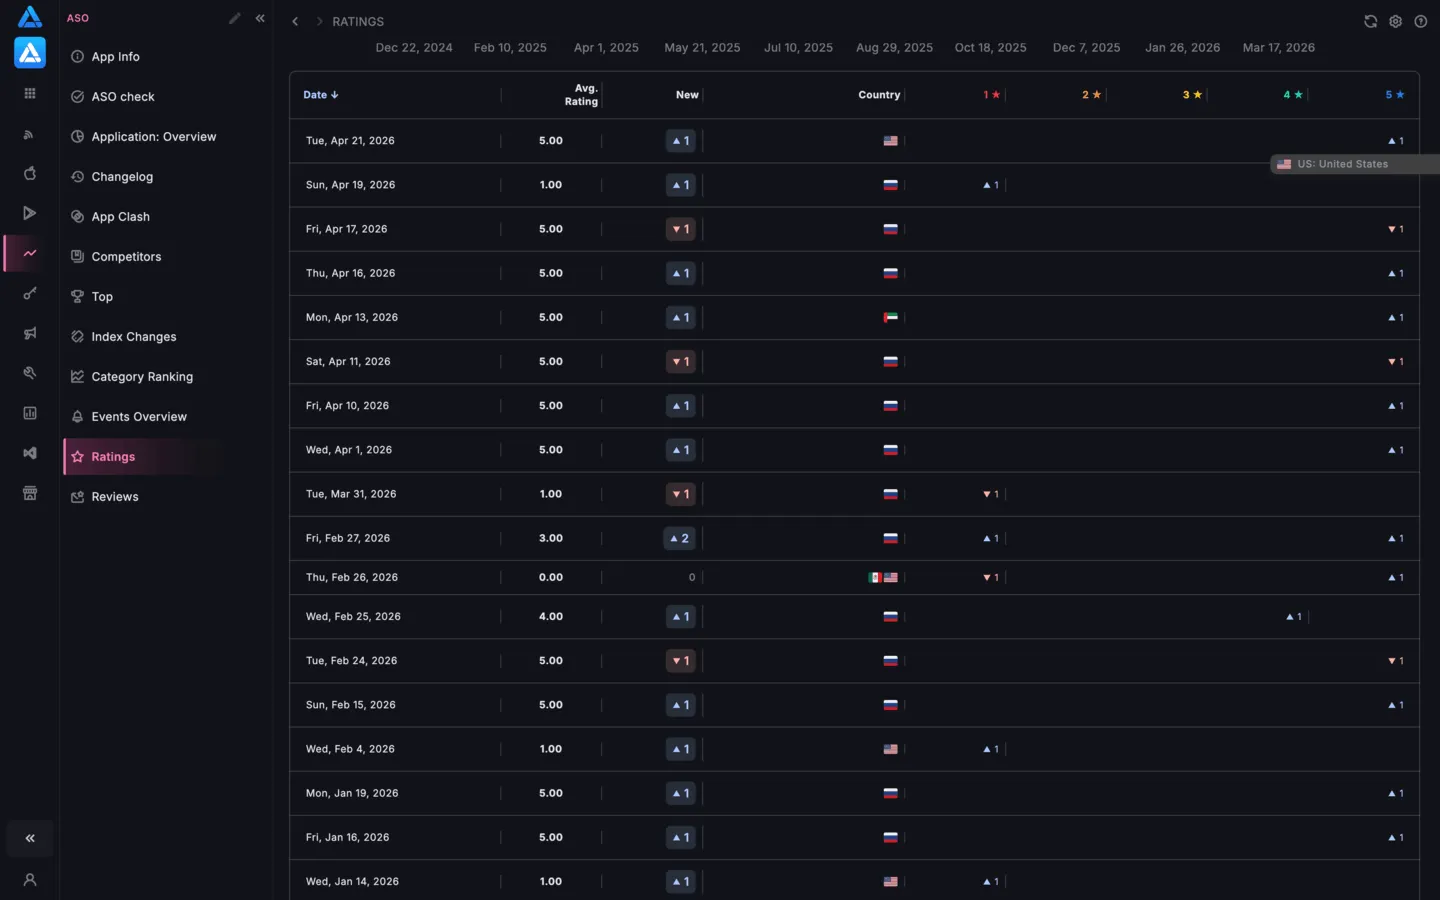
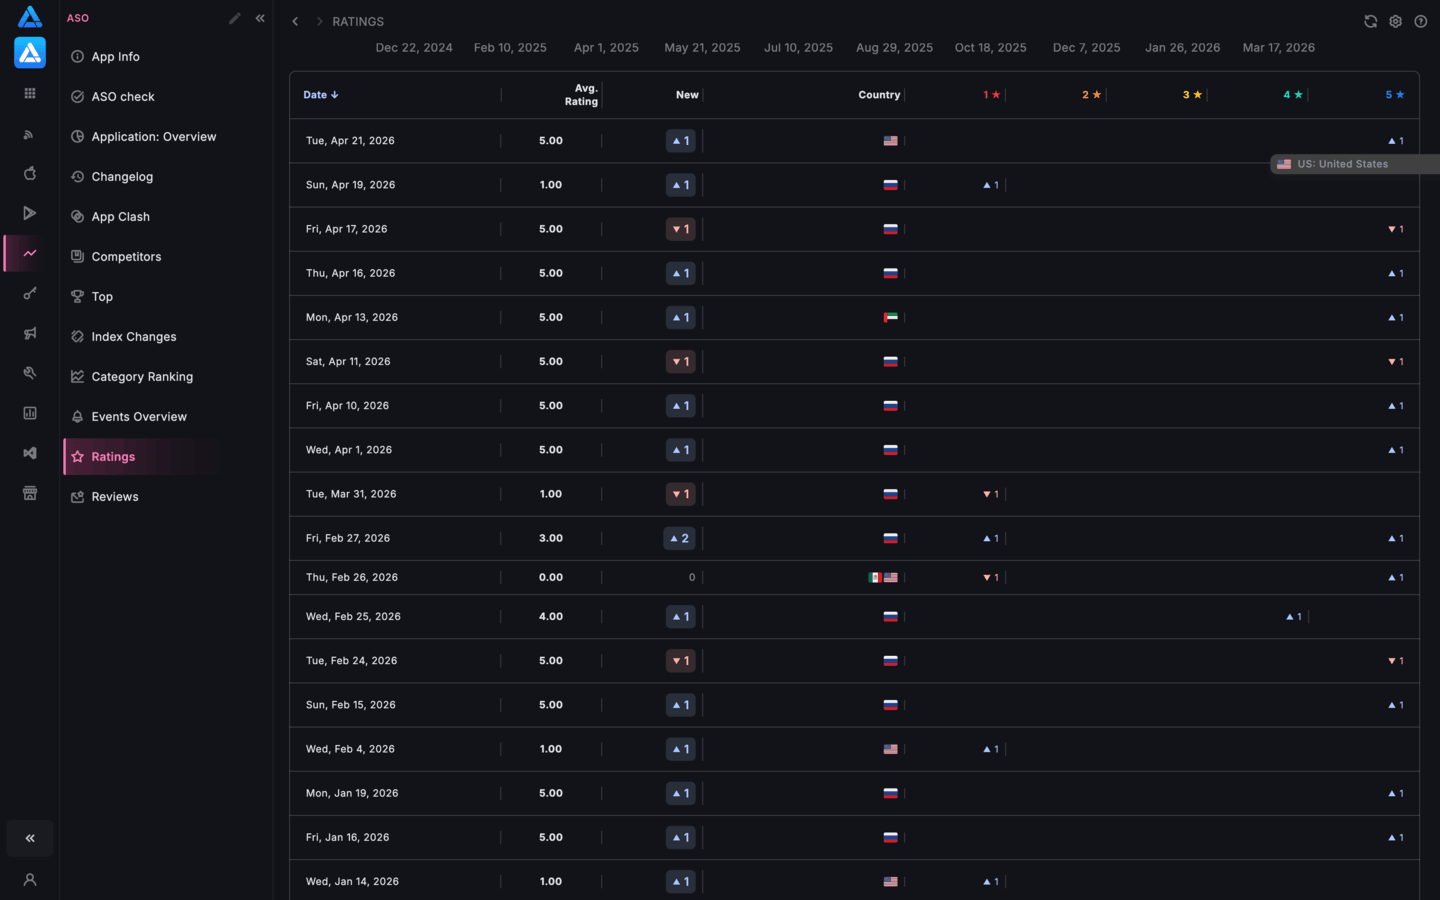
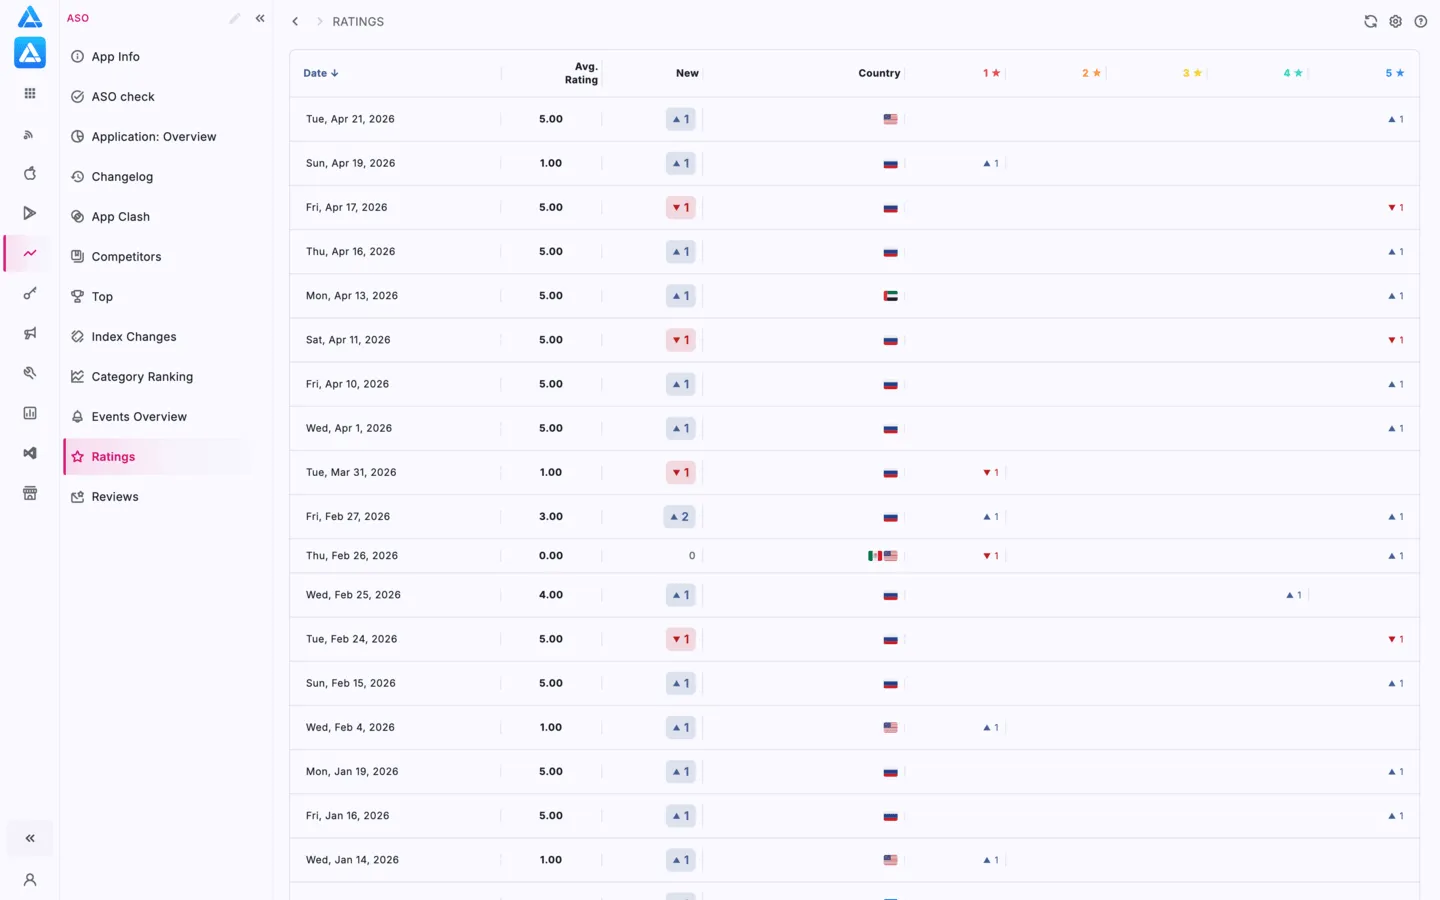
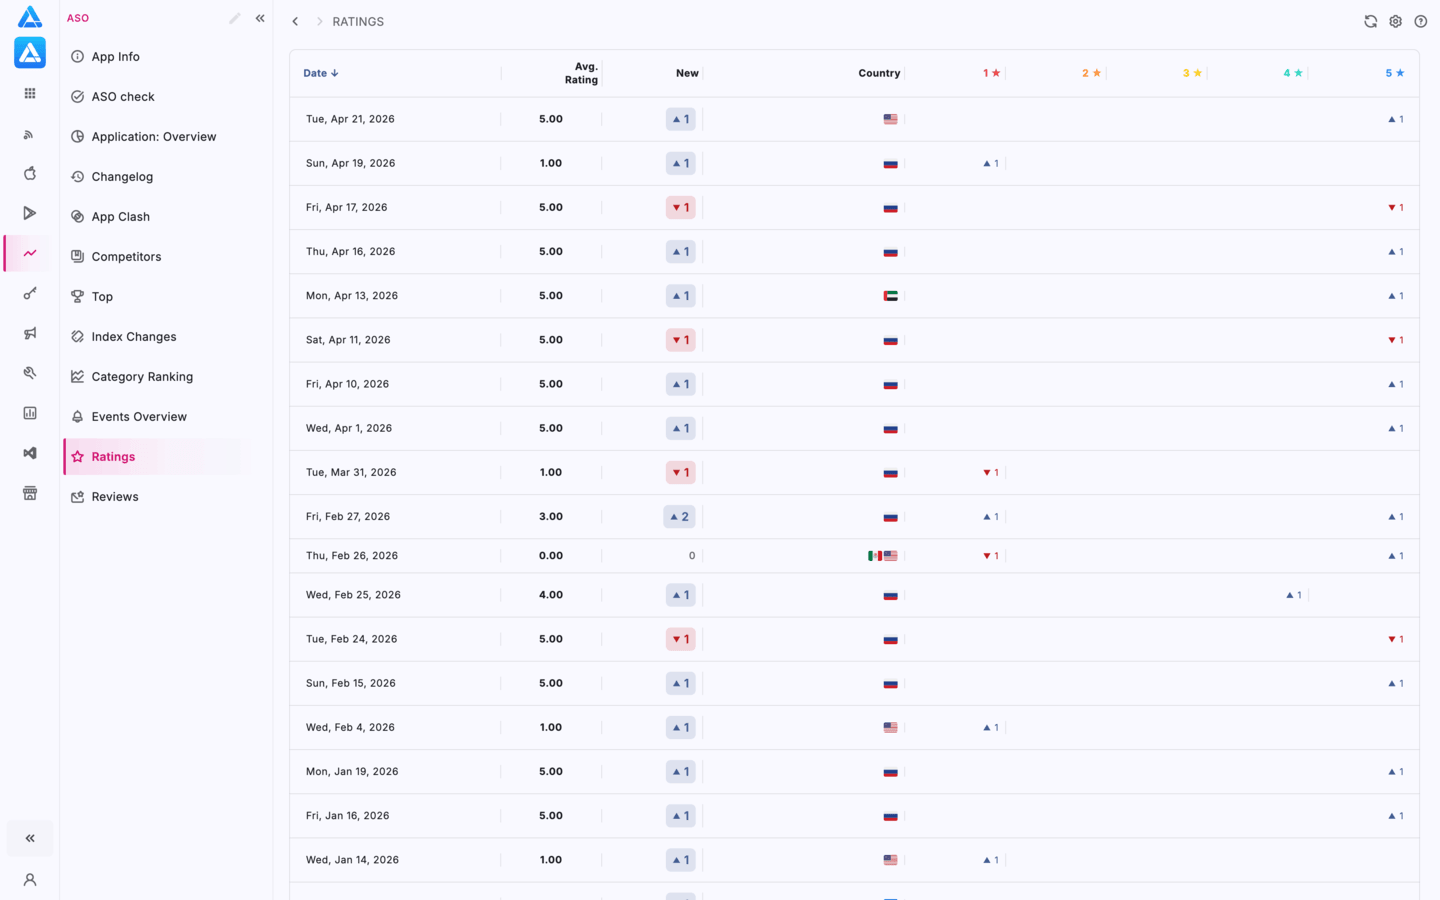
Use it to spot rating spikes or drops after a release, update, campaign, or traffic change.
How to Use It
Section titled “How to Use It”- monitor app quality after releases
- find countries where rating drops faster
- see which star ratings affect the average score
- compare new and total ratings
- understand how app reputation changes over time
Ratings matter for ASO because they influence user trust, install conversion, and how the app is perceived in App Store search.