App Store Keyword Rankings: Daily Search Rank Tracker
For memberships with access to the ASO analysis: Indie, Pro and Marketing
Keywords: Ranking in ASO.dev is a powerful tool for analyzing and optimizing your app’s visibility in the App Store.
Data visualization in the form of tables and charts makes it easy to evaluate the performance of keywords across different countries and time periods, allowing you to make informed decisions to improve your app’s rankings and attract more users.
ASO.dev allows you to select different time ranges:
- Today - displays rankings for current & previous days (for analyses purposes)
- 7 days
- 30 days
- 60 days
- Week - current week from Sunday
- Month - current month from the 1st date of the month
- All - all available data
- Custom - select a custom date range
History for the last 30 days for the Indie membership
For the Pro and Marketing memberships without date restrictions
Main data
Section titled “Main data”The table contains a lot of data, but when you hover over any value, a tooltip will appear.
Keywords screen displays key metrics for all important keywords, including their positions, difficulty, search popularity (SAP - Search Ads Popularity), and the number of apps competing for these keywords.
Keywords
Section titled “Keywords”Each keyword in the table is highlighted in color based on your app’s metadata, considering Cross-localization
- Green: Keywords in the title
- Orange: Keywords in the subtitle
- Yellow: Keywords in the keywords field
Not ranked keywords are highlighted as follows:
- : No longer ranked
When searching in the keyword column, color highlighting is also applied to the search results.
- Search - Exactly matches the search phrase including word order (strict match).
- Search - Some words from the search phrase are present.
- Search - Only partial matches within words (for example, matching part of a word).
When you hover over a keyword, a tooltip provides detailed information, including:
- Keyword: The keyword itself.
- The field where the keyword is used (e.g., title, subtitle, or keywords field).
- The locales where the keyword is utilized.
Clicking on a locale name will navigate you directly to the corresponding locale in the Metadata Editor, allowing for quick edits and adjustments.
Under each keyword in a language unfamiliar to you, a machine translation is displayed.
You can change the translation language in Settings > Language > Base language for translations.
Keywords: App Search
The chart button next to each keyword opens the Ranking of applications for that keyword in the Search results.
Keywords Tracking
The bookmark button next to each keyword allows you to add the keyword to your project’s Keywords Tracking List or exclude it.
The button on the “Keywords” column works as a filter and allows you to quickly check positions based on your Keywords Tracking List.
Suggestions
Section titled “Suggestions” Icon of a light bulb with a number: shows the number of suggestions in the search results for the selected keyword.
This is useful for filtering out branded keywords or rarely used search terms.
By analyzing the number of suggestions, you can determine how often this word is used by users and adjust your strategy accordingly.
- High number of suggestions: This means the keyword is frequently used by users in search queries.
Such words may be important to include in your strategy as they have high traffic potential. However, be mindful of branded keywords, which can generate many suggestions but may not be relevant to your app. - Low number of suggestions: This indicates that the keyword is rarely used in searches.
These words may be less competitive but should be justified-if they match your app’s content and target audience, you can include them in your strategy to attract niche users.
When you click on the light bulb, a window opens with suggestions that can be added to the list of tracked keywords .

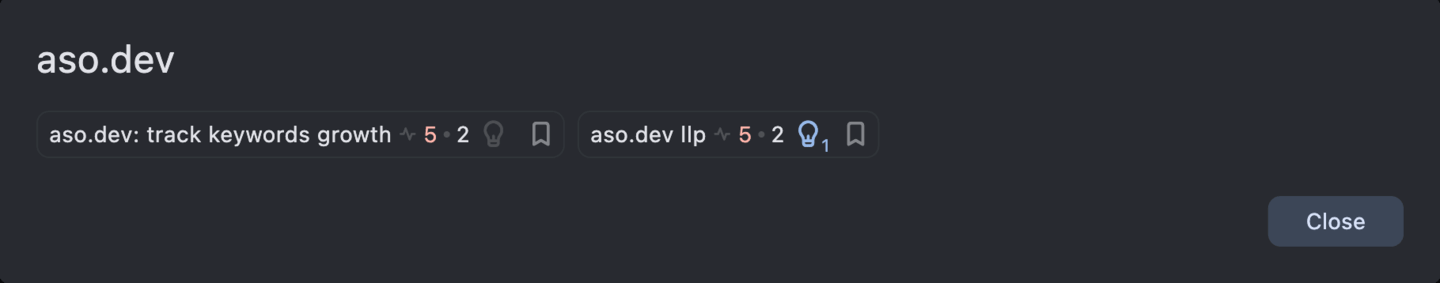

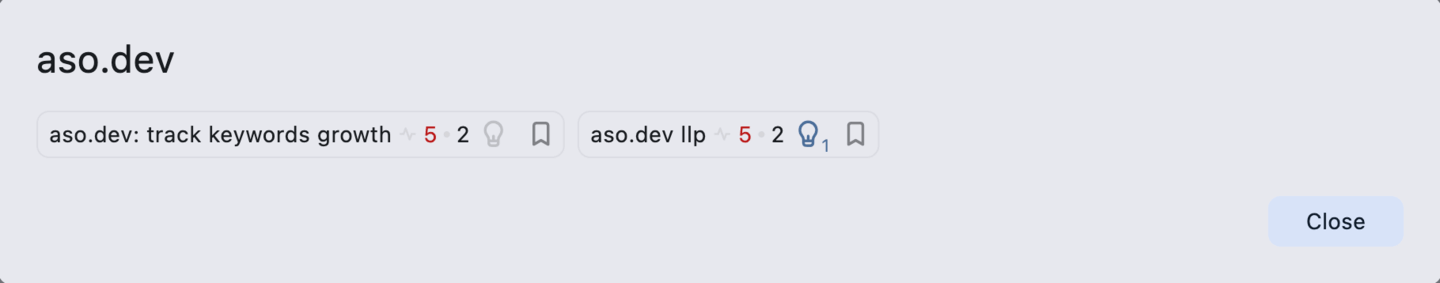
All keyword metrics are shown relative to the selected country.
In the suggestions window, you can:
- Add a keyword to the list of tracked keywords using the button with the flag.
- View the history of the keyword’s popularity in the form of a graph - to do this, click on the red number with the icon .
- Navigate to suggestions for each word in the list - to do this, click on the icon with the light bulb .
This can help you discover new keywords that you might not have even considered.
Search Ads Popularity (SAP)
Section titled “Search Ads Popularity (SAP)” Search Ads Popularity (SAP) reflects how often users search for a particular keyword.
The higher the popularity, the more traffic that keyword can generate, but competition for it will also be higher.
For memberships with access to the ASO analysis: Indie, Pro and Marketing
Search Ads (SAP) Popularity - keyword popularity in search based on data from Apple Ads.
When you hover over the Search Ads popularity (SAP) value, a tooltip will display the date of the last update of this parameter in the database.
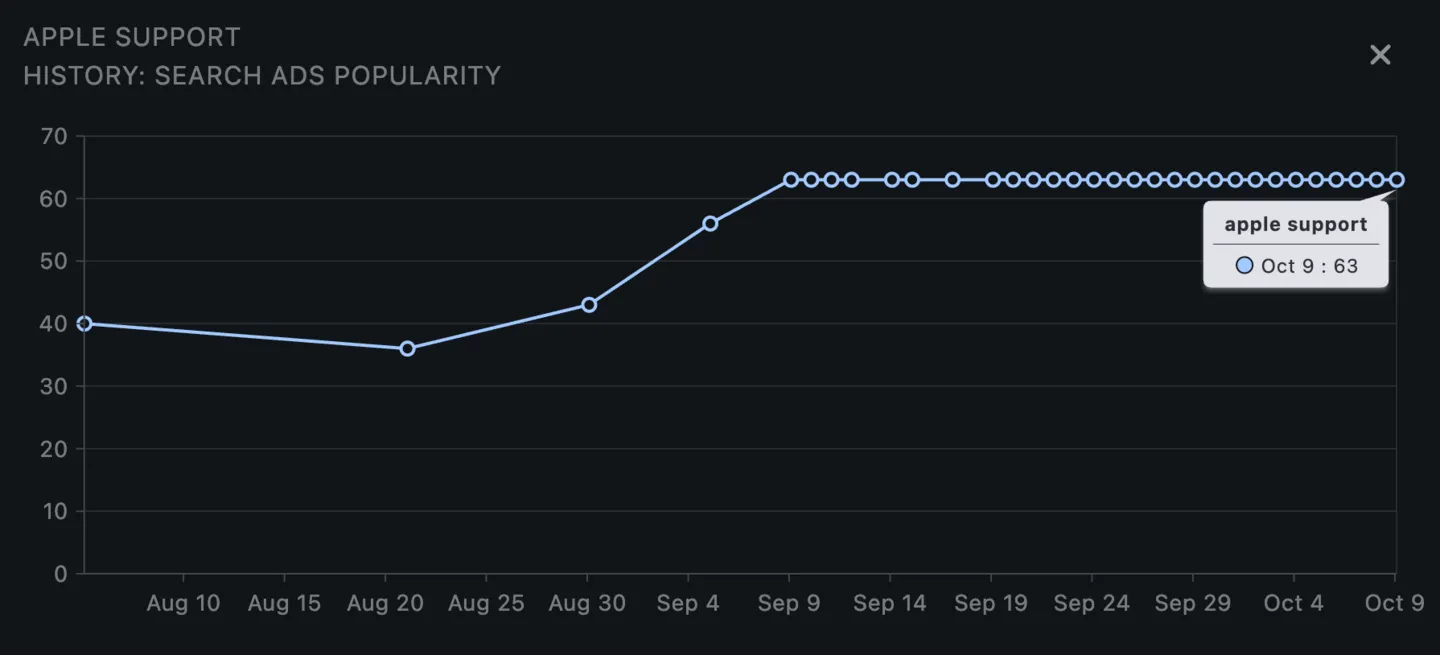
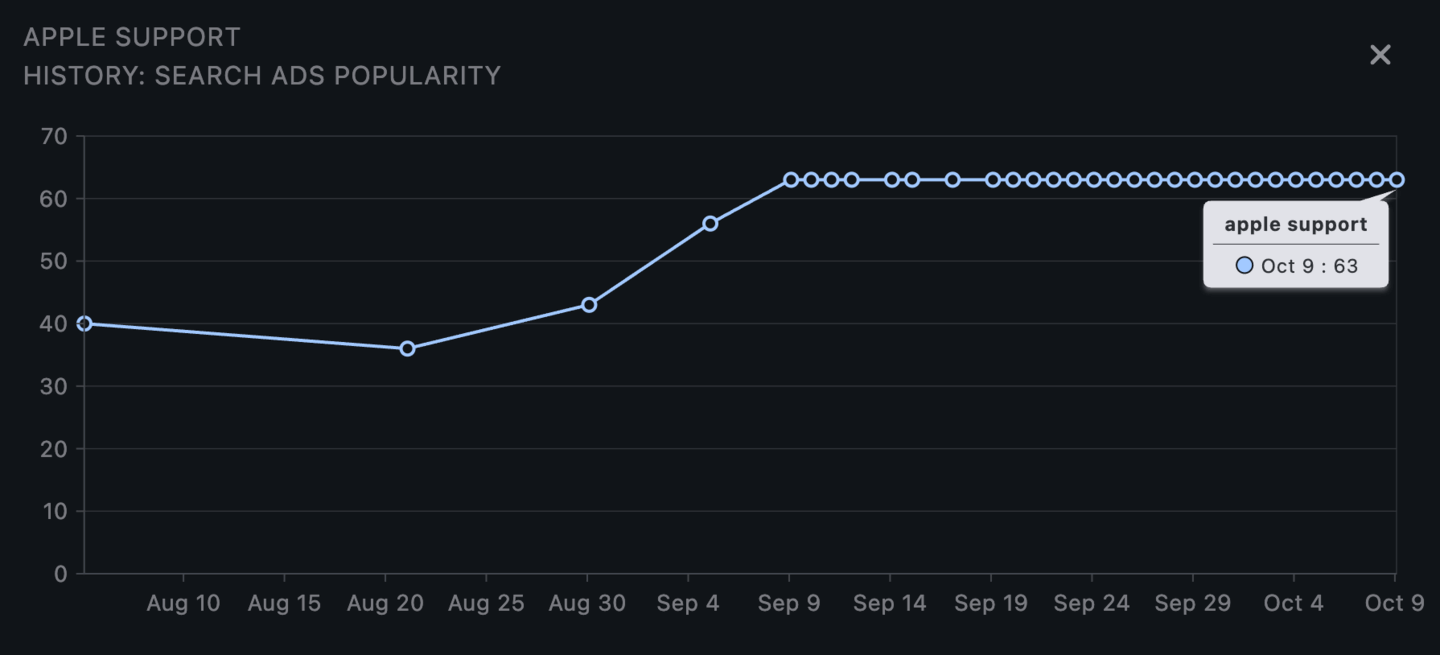
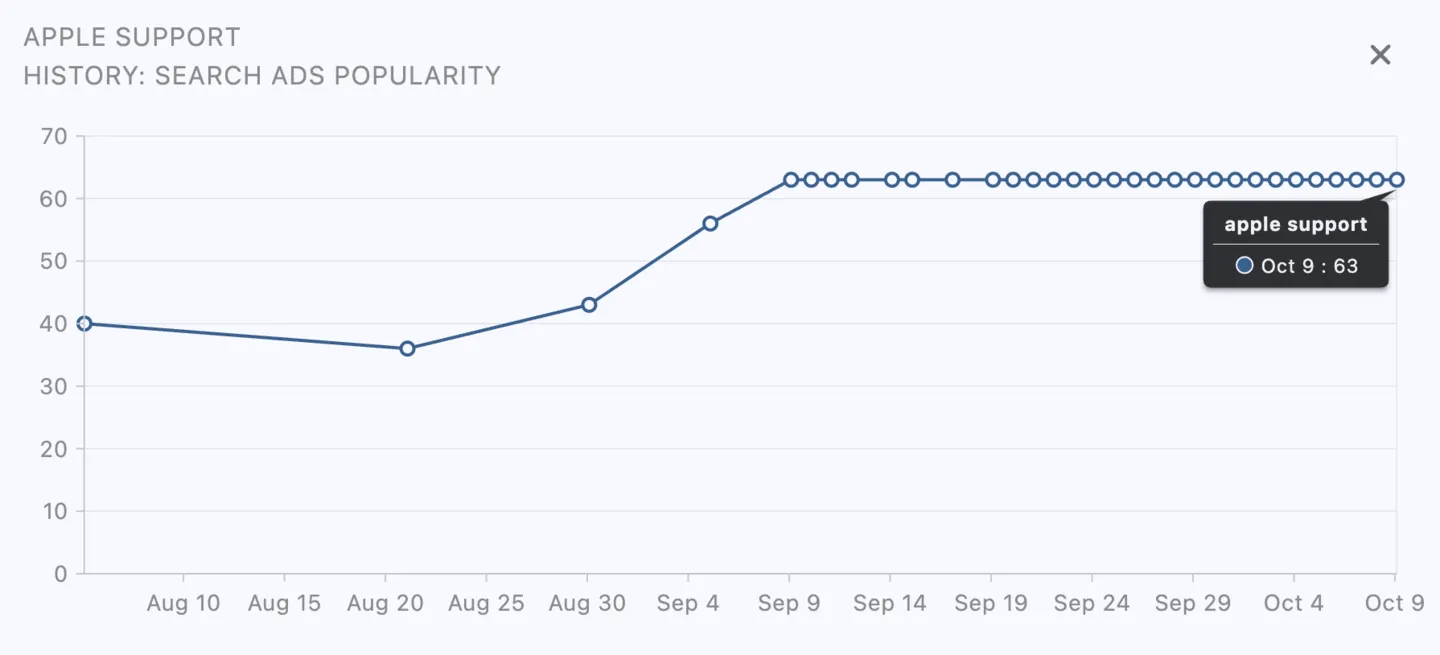
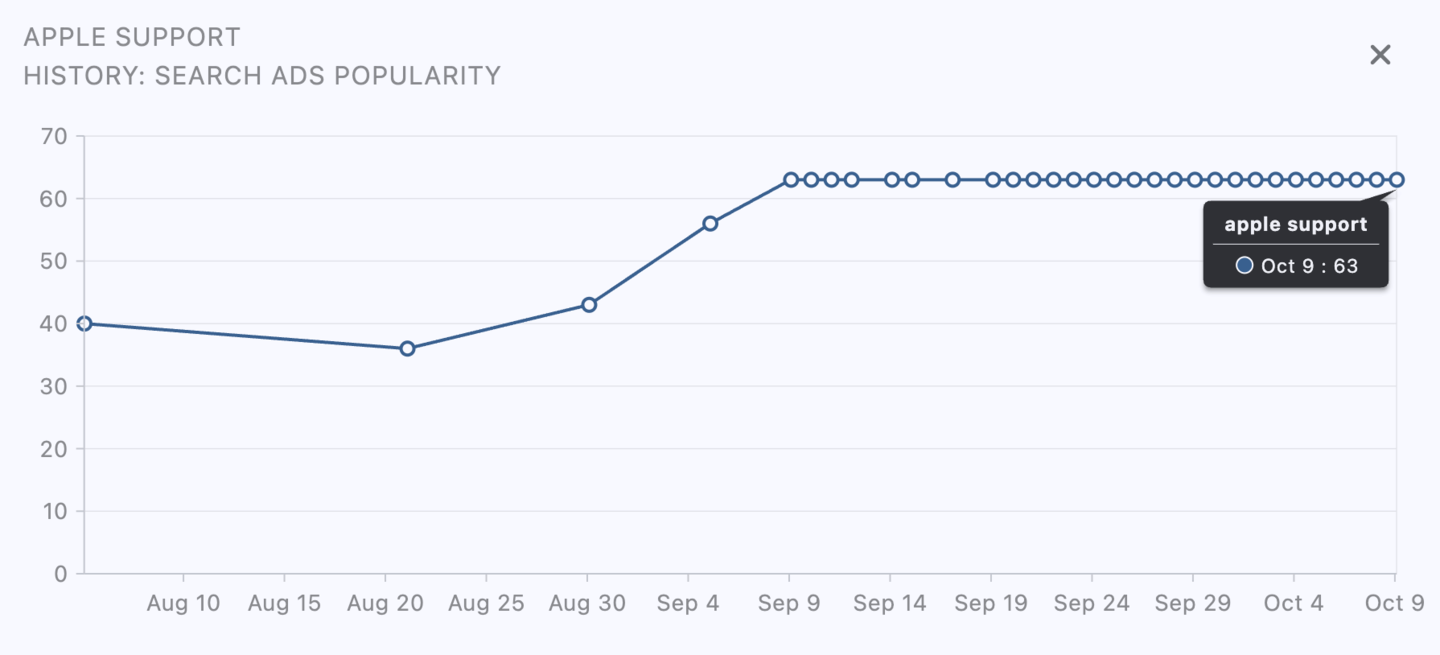
Tapping on the SAP value opens an alert with the complete history of Search Ads Popularity for selected keyword.
This allows you to track keyword performance trends over time, giving you valuable insights to refine your ASO strategy.
History for the last 30 days for the Indie membership
For the Pro and Marketing memberships without date restrictions
Historical data is available from September 2024.
Search Ads Popularity can also indicate how often advertisers use a particular keyword in their ad campaigns.
It shows how frequently app developers bid on this keyword in paid ad networks, such as Apple Search Ads, to increase the visibility of their apps.
High popularity may indicate that the keyword is in demand among advertisers, increasing the competition for it in paid campaigns.
- Very High (85 - 100): Extremely high search volume, maximum competition.
When to use:- For brand names or top-level generic keywords.
- Ideal for strong brands or apps with high budgets and conversion rates.
- Risky for small apps unless highly relevant.
- High (60 - 84): High traffic, but also high competition; best suited for well-known apps with sufficient resources for promotion.
When to use:- For apps with established user bases.
- Requires competitive budgets and strong marketing strategies.
- Ideal for boosting visibility in competitive categories. When to use:
- For scaling campaigns.
- Requires stronger creatives and good App Store page optimization.
- Best if you can handle mid-to-high CPI (cost per install).
- Medium (20 - 59): Moderate search volume with a decent balance of traffic and competition, suitable for steady app growth.
When to use:- Main zone for growth-stage apps.
- Reliable for sustainable downloads with controlled budgets.
- Good starting point for long-term keyword strategies.
- Low (6 - 19): Small search volume, but better than very low. Suitable for niche keywords with less competition but lower traffic.
When to use:- Good for initial keyword expansion.
- Catch small but targeted audiences.
- Use when competition is too tough for bigger keywords.
- Very low (0 - 5): Extremely low search volume.
When to use:- For highly niche keywords; experiments; very low-budget campaigns.
When launching an app in a new category or country, it’s recommended to start with low-popularity keywords to increase the chances of high search rankings.
As your app gains traction and builds a user base, move on to medium-popularity keywords.
For apps that are already established and have a stable user base, high-frequency keywords with high popularity can be used.
Each time you view a keyword on screen (in the keywords or Metadata Editor), we automatically increase its priority for updating the popularity data.
So, if you see a value of 0, no data, or outdated information - it will be prioritized for an update, which will occur either within a few seconds or by the next day, depending on the server’s data processing queue.
After October 2025, an average Search Ads Popularity (SAP) value is used to display more accurate data:
The average popularity is calculated from all available data starting from September 1, 2025.
Values with popularity of 5 that appeared after September 29, 2025, are not included in the calculation.
If no data is available for the selected keyword and country after applying these filters, the last known popularity value and corresponding date from historical data before September 1, 2025, is used.
Search Ads Popularity (SAP) History
Section titled “Search Ads Popularity (SAP) History”Available only for the Pro and Marketing memberships.


Displays the history of changes in Search Ads Popularity (SAP) for a keyword since September 2024:
- Minimum - the lowest recorded value.
- Maximum - the highest recorded value.
- Average - the average value over the period.
Color indication:
- Gray - the SAP value has not changed (matches the current value).
- Blue - the keyword’s popularity is increasing.
- Red - the keyword’s popularity is decreasing.
Difficulty
Section titled “Difficulty”The difficulty metric measures the Competition Level: the higher the value, the harder it is to rank at the top for this keyword.
It is calculated based on Search Popularity and the Number of Apps that use this keyword as a key term.
The color scale reflects the level: Green (low) to Red (high).
Number of apps
Section titled “Number of apps”How many apps are in the search results for this keyword.
The lower the number, the less competition.
Up to 200 - exact number is shown.
After 200 - the number is approximated by Apple.
This approximation is more accurate than the generic “250+” for keywords like Fitness, so we choose to display it instead.
Guided Search
Section titled “Guided Search”Guided Search is a feature introduced by Apple that displays search tags below the App Store search bar, helping users refine their queries.
When a user enters a broad keyword (e.g., running tracker), the App Store suggests related tags such as walking, distance, speed, steps, and fitness.
Tapping a tag instantly filters the search results, providing a more targeted experience.
For example, tapping walking will update the search to running walking tracker, showing apps that specifically focus on walking features.
ASO.dev displays the number of tags available for each keyword.
Tapping a opens the Guided Search screen, where you can view all search phrases associated with each tag.
Available only for the Marketing membership.
- Shows the number of apps using this keyword in their ad campaigns.
When you click the icon, you see the Keywords: Ads, percentage of apps that use this keyword in advertising, relative to all apps indexed by this keyword in the App Store.
This helps you understand how actively the keyword is used specifically in ad campaigns. - Keyword Ads lets you see which apps are advertising for the selected keyword, sorted by the number of impressions in search.
Hovering over an app icon shows a brief info card, and clicking it takes you to the App Ads screen, where you can see which keywords and creatives are used for ads by that specific app.
Trend is the difference between the average value over the selected interval (excluding drops from rankings) and the current value.
- Blue an increase in rankings.
- Red: a drop in rankings.
It shows how the keyword’s ranking in search results has changed compared to its average position over a specific time period, helping to assess whether its performance is improving or declining.
Keyword rankings
Section titled “Keyword rankings”The ranking shows the position of the keywords in the search results in the app store.
Next to it, at the top of the table cell, is the difference from the previous day: a blue arrow indicates growth, and a red arrow shows a drop in positions.
and a red number in the date column represent the SAP popularity value.
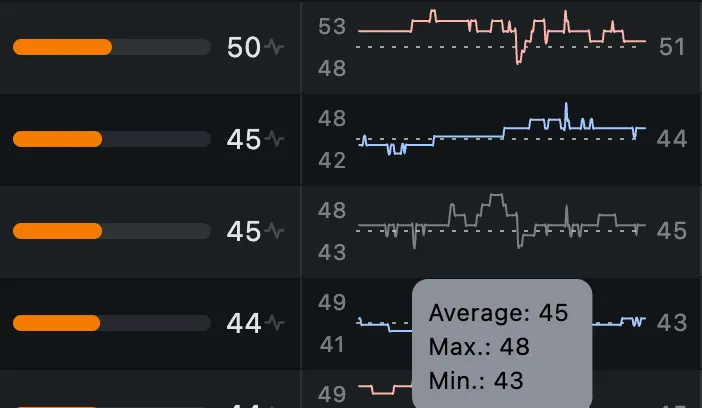
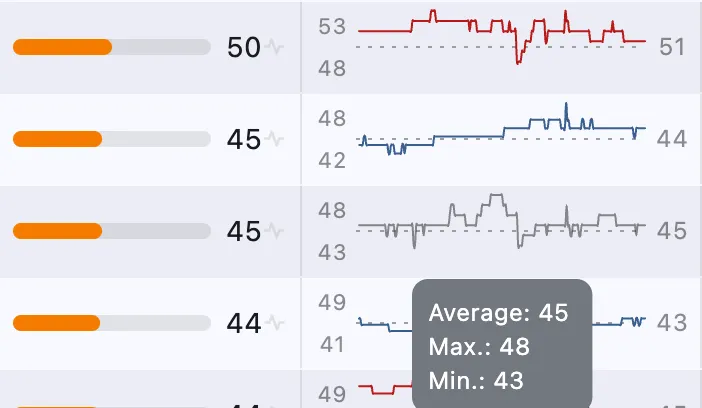
Average keyword ranking
Section titled “Average keyword ranking”This metric shows the average ranking position for a keyword.
The chart displays how your app’s position for a specific keyword has changed over time, allowing you to quickly assess trends and determine if your search visibility is improving or declining. The chart shows the minimum, maximum, and average positions for each keyword.
If a keyword drops out of the rankings, a ”?” is displayed instead of the minimum position.
Data display options
Section titled “Data display options”Table by country (for all dates and keywords)
Section titled “Table by country (for all dates and keywords)”In this view, the columns represent dates, and the rows represent keywords for one country.
This allows users to analyze the performance of keywords in different countries over time.
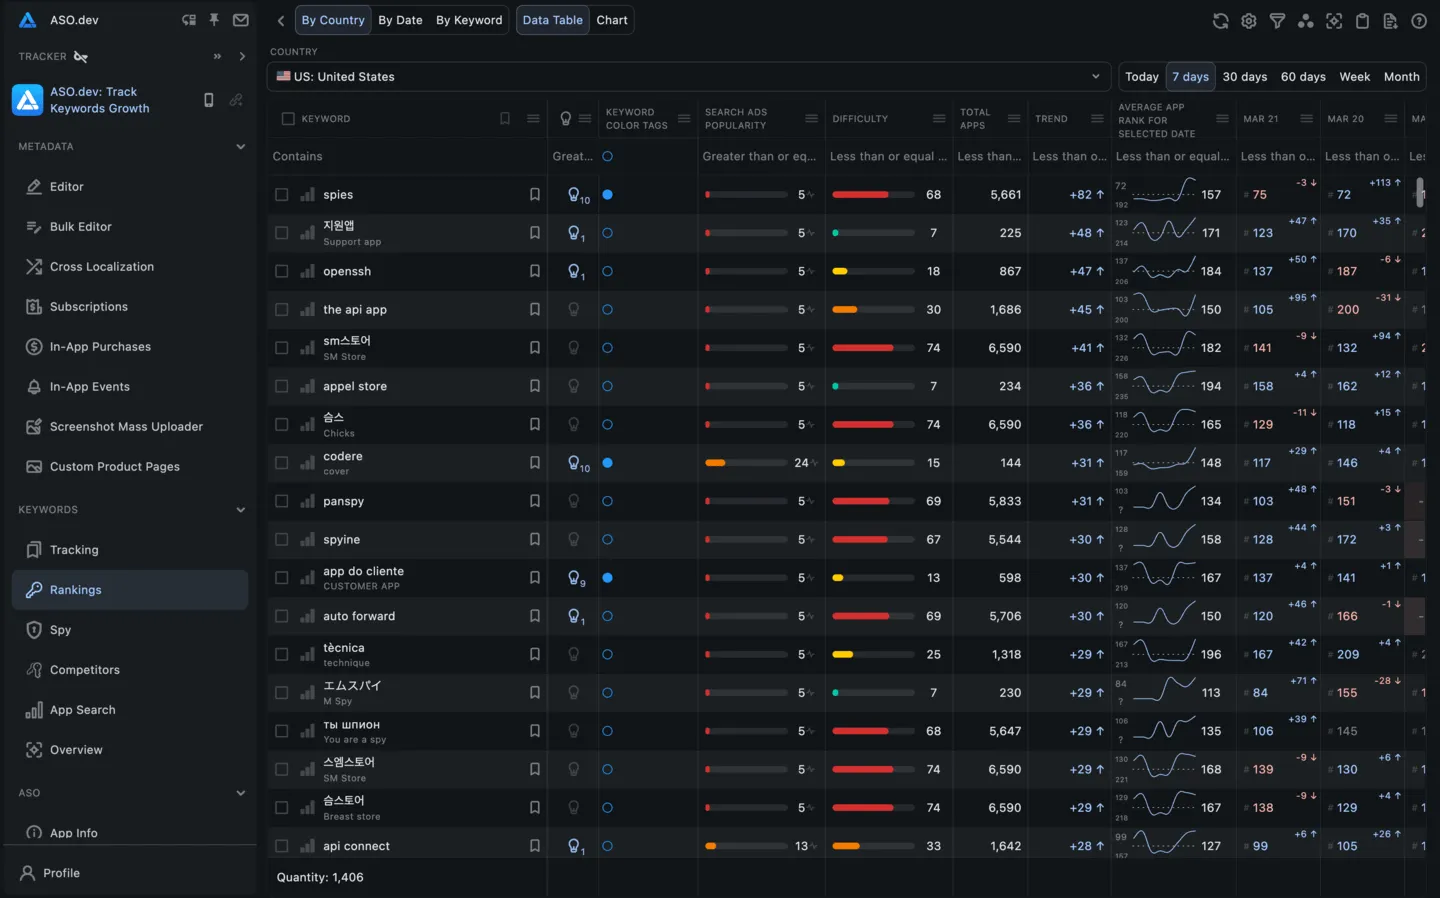
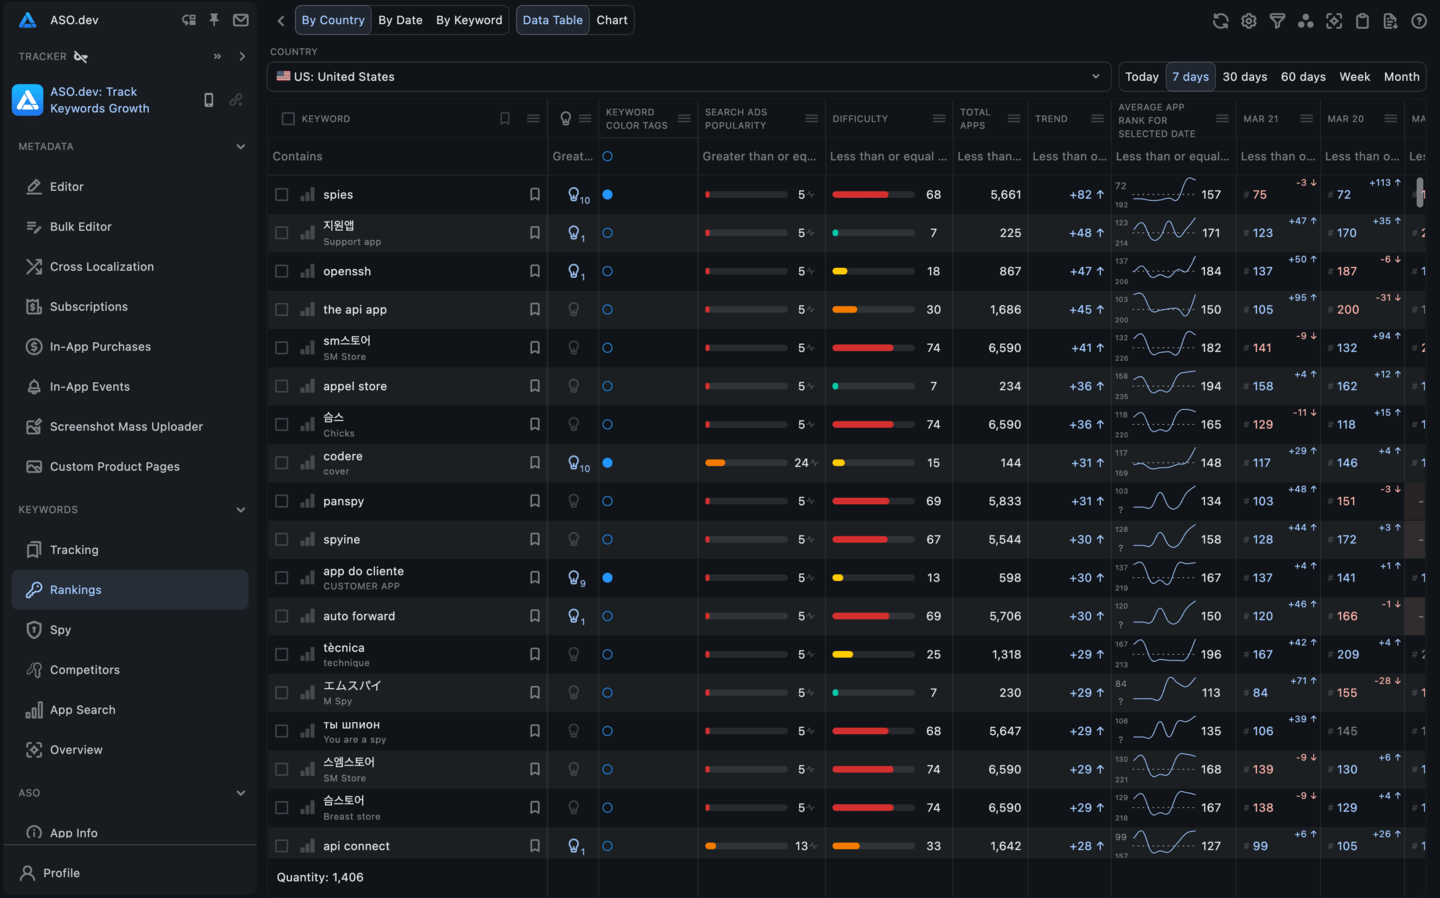
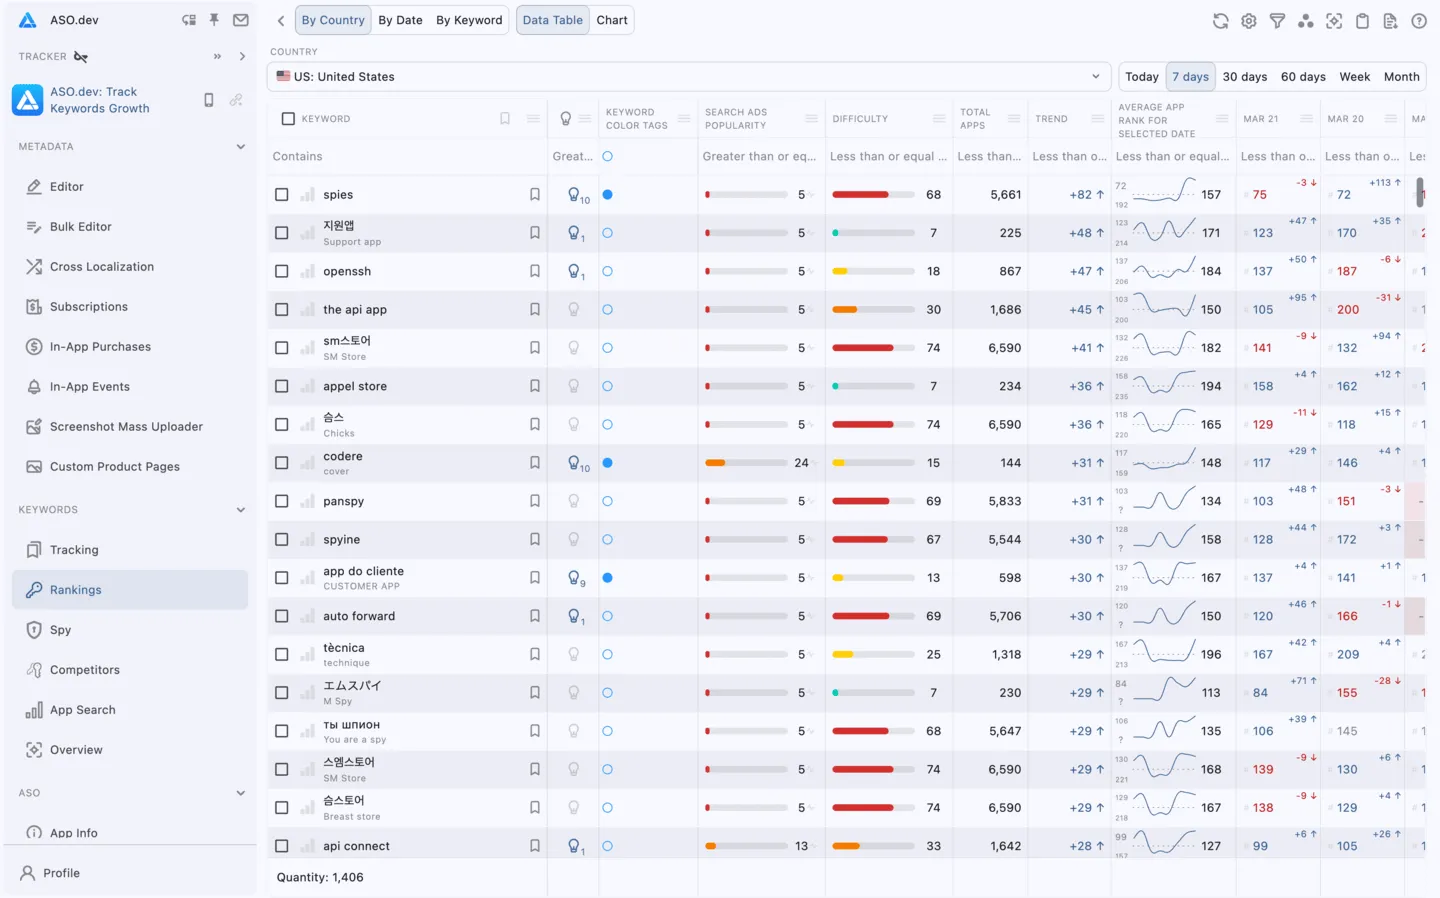
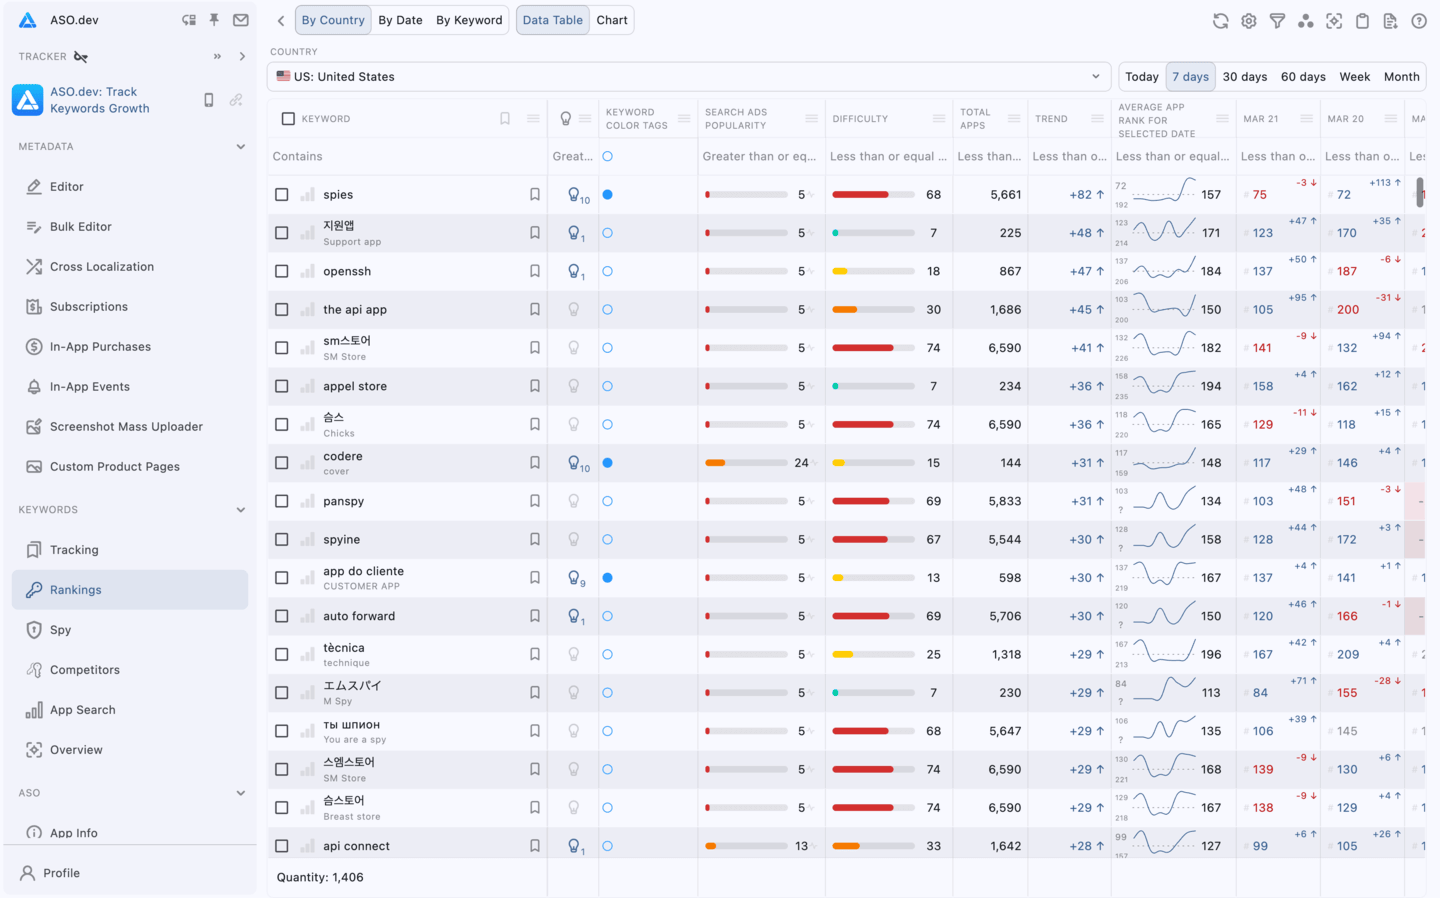
Chart by country (for all dates)
Section titled “Chart by country (for all dates)”The chart shows the distribution of keywords by search positions in the App Store for all keywords on each date for one country.
It also shows the change in the number of keywords in each category over the entire period.
- Top 1 - 1st position
- Top 5 - positions 2 to 5
- Top 10 - positions 6 to 10
- Top 20 - positions 11 to 20
- Top 50 - positions 21 to 50
- Top 100 - positions 51 to 100
- Total number of keywords
History for the last 30 days for the Indie membership
For the Pro and Marketing memberships without date restrictions
With a mini-chart for each keyword category, showing the change in positions over time.
Red indicates a decline, blue an increase, and gray no change in keyword count.
The chart shows the minimum, maximum, and average number of positions for each keyword category.
Hovering over the chart displays the exact number of keywords in each category, as well as the change in quantity compared to the previous day.

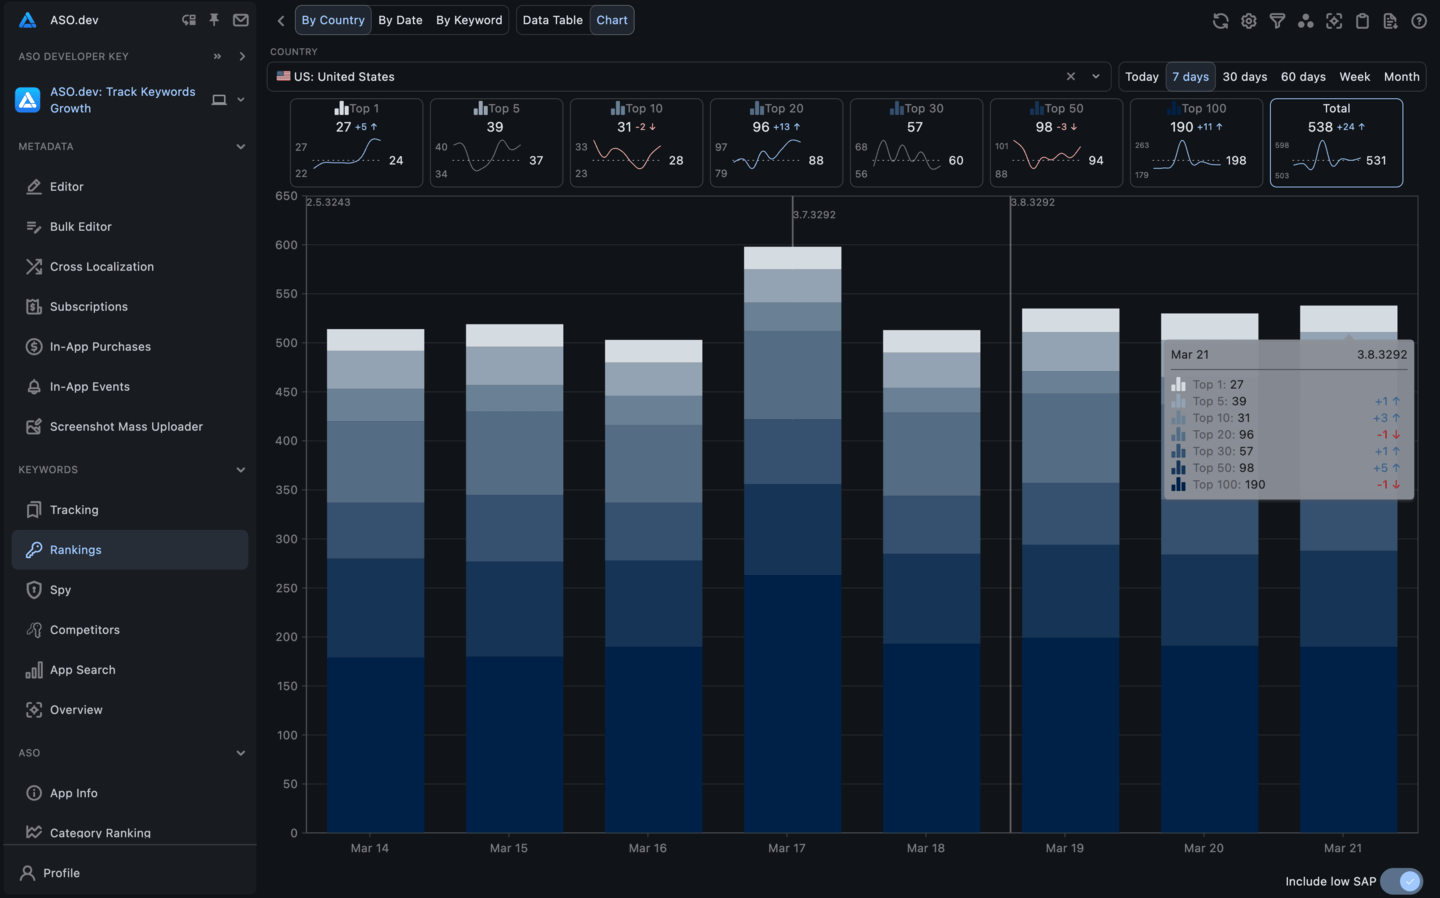

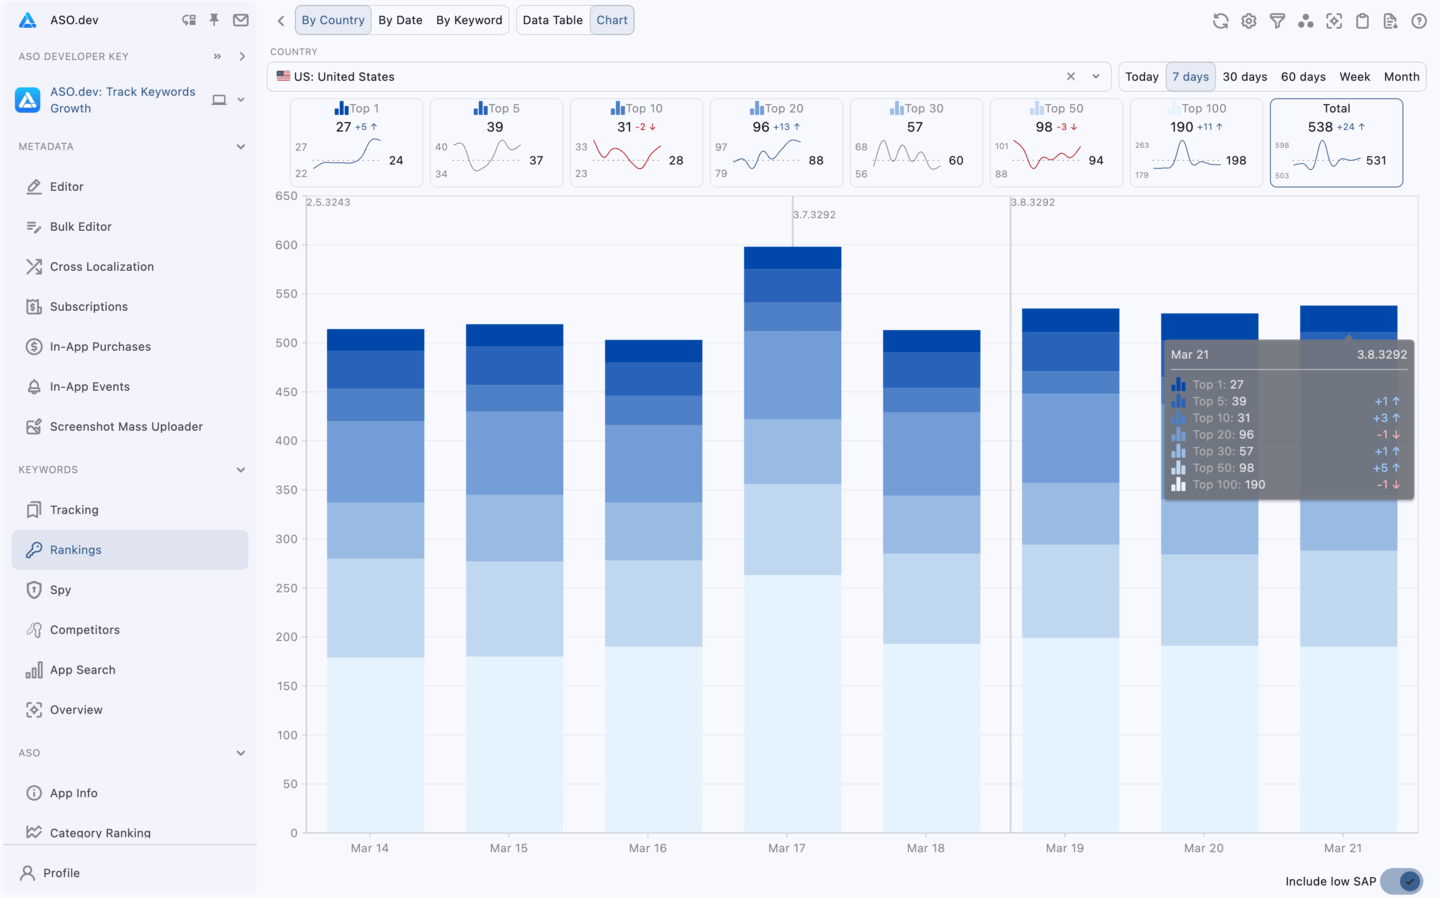
Stacked Column Chart is the default chart type in monochrome mode.
You can choose another chart type and color scheme in the Settings > Charts.
Chart types
Section titled “Chart types”Chart Type - choose the type of charts that you prefer to use for visualizing keyword data.
- Column Chart - a chart in the form of separate columns, where each column corresponds to a specific position range.
- Stacked Column Chart - by default, a chart in the form of columns, where each position range is displayed in its color inside one column.
- Normalized Stacked Column Chart - similar to Stacked Column Chart, but all columns have the same height (100%), and the percentage of keywords in each range is shown inside.
- Line Chart - shows the change in the number of keywords in each position range over time as separate lines, each starting from 0.
- Spline Chart - the same as Line Chart, but with smooth lines instead of sharp angles.
- Stacked Linear Chart - the values of position ranges are summed up, each line is built on top of the previous one, creating an accumulation effect.
- Normalized Stacked Linear Chart - similar to Stacked Linear Chart, but normalized in percentages (summing up to 100%).
- Area Chart - a chart in the form of filled areas, where each area corresponds to a specific position range.
- Spline Area Chart - similar to Area Chart, but with smoother lines for better visualization.
- Normalized Area Chart - similar to Area Chart, but all areas have the same height (100%), and the percentage of keywords in each range is shown inside.
Table for a specific date (for all countries and keywords)
Section titled “Table for a specific date (for all countries and keywords)”In this view, the columns represent countries, and the rows represent keywords.
The table provides insight into the performance of keywords in different countries on a specific date.
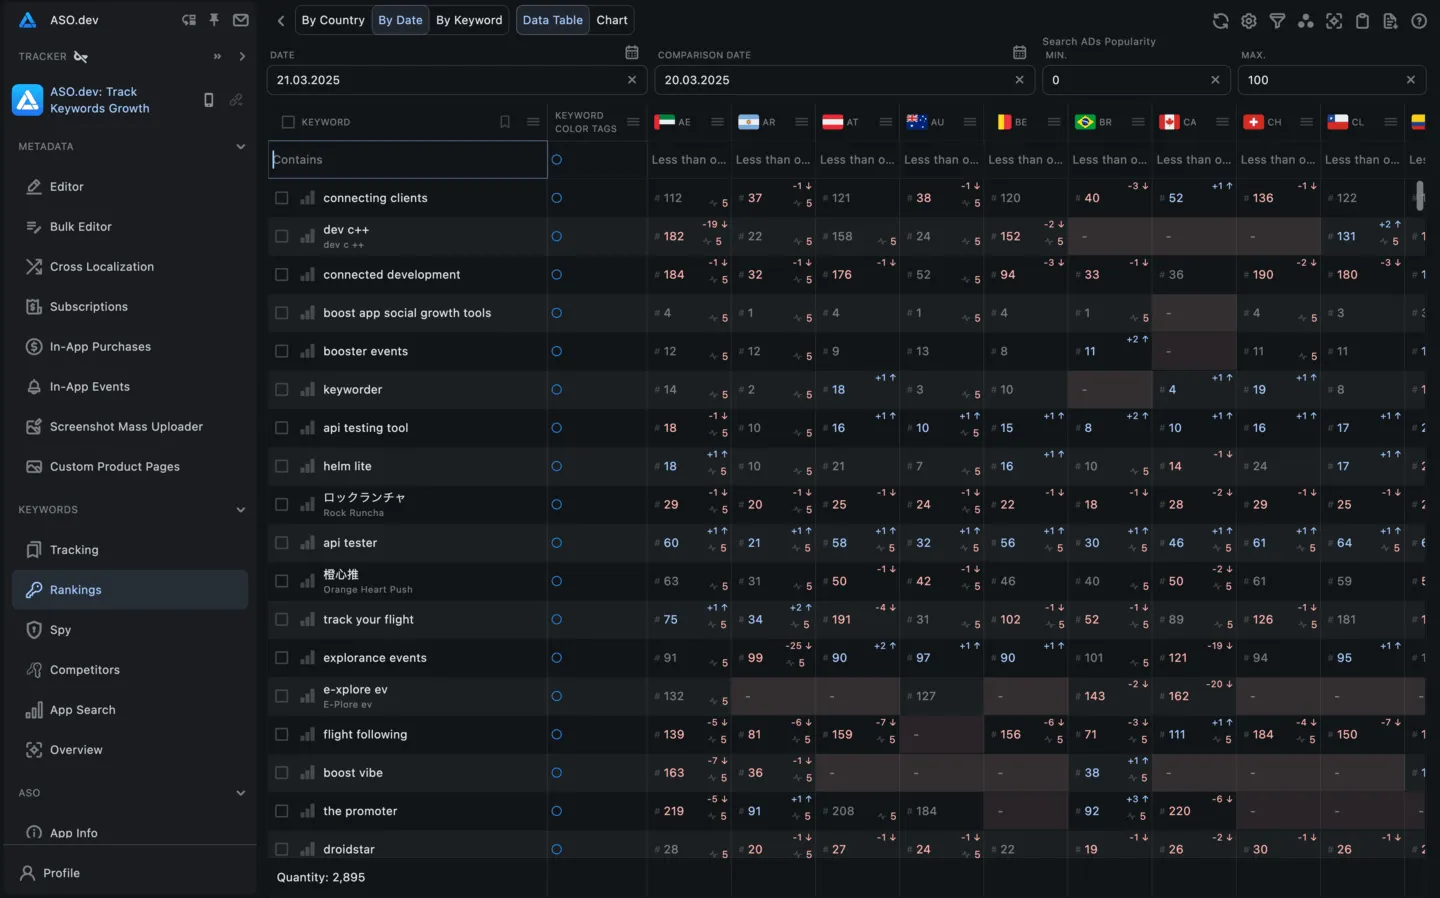
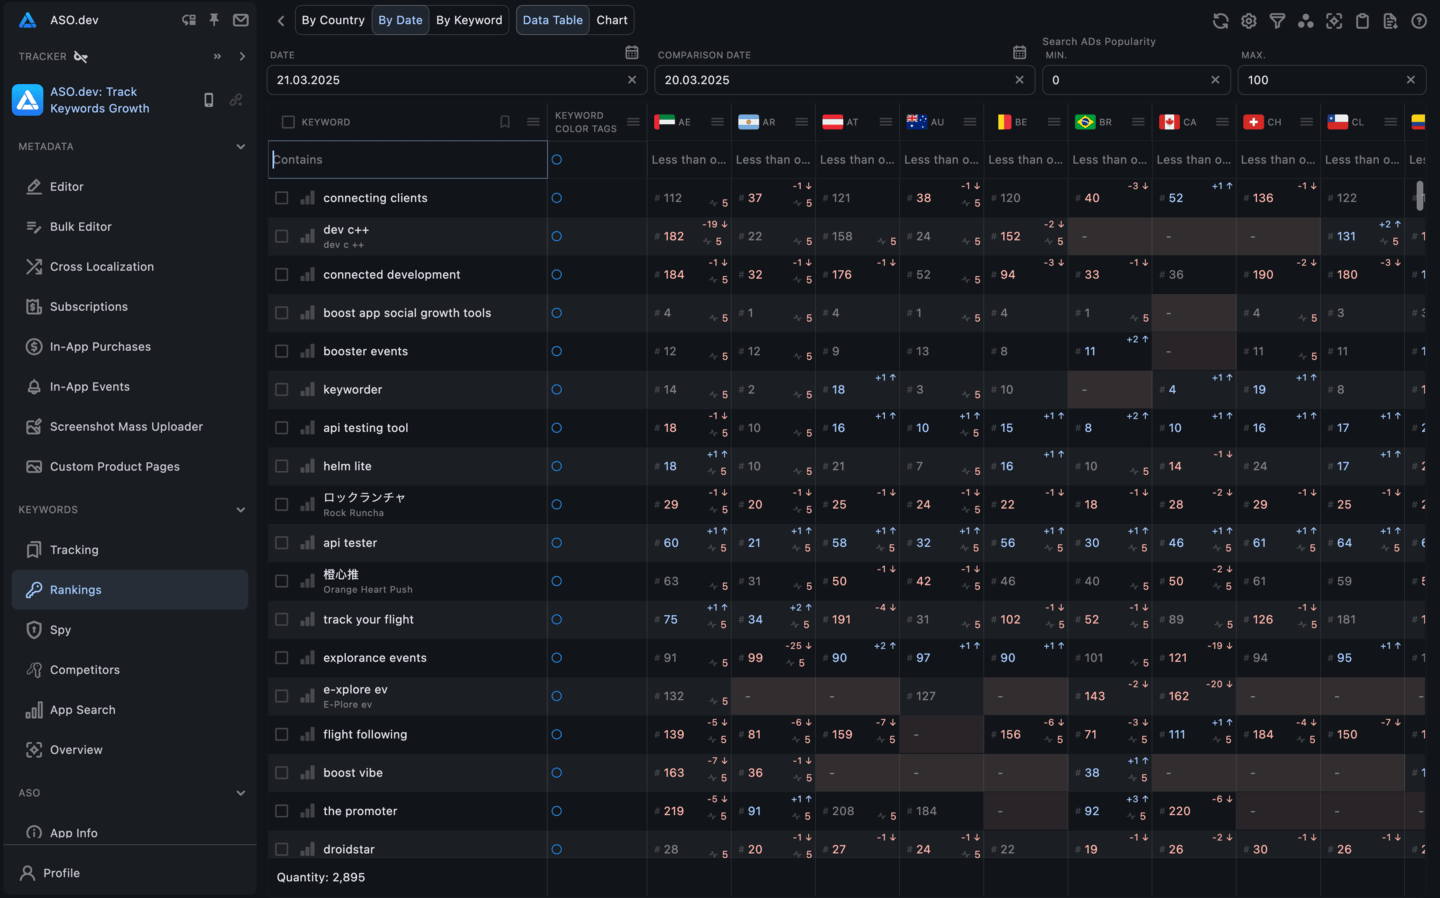
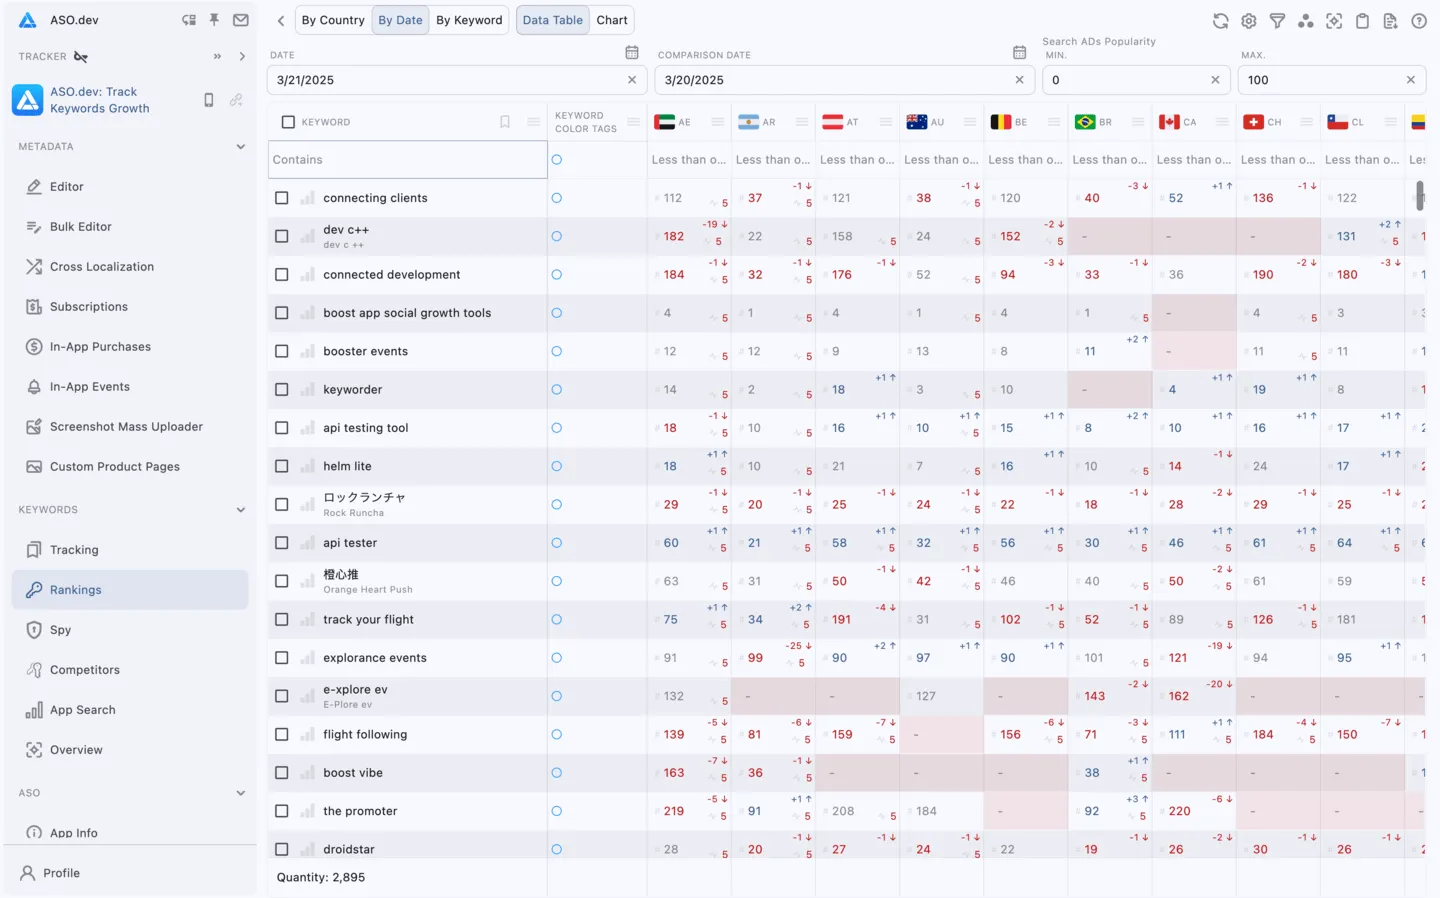
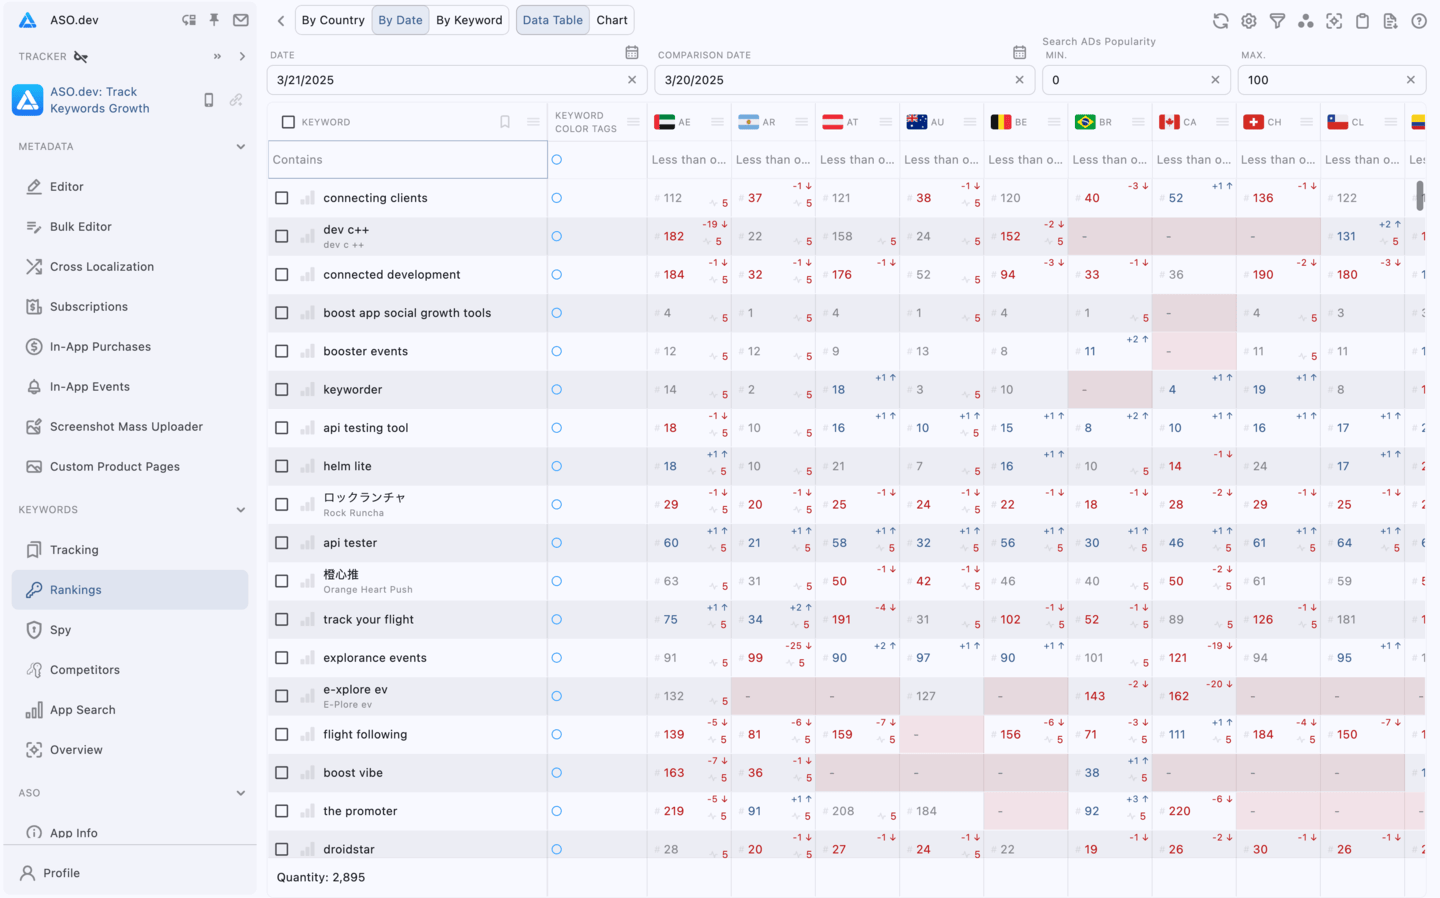
Chart for a specific date (for all countries and keywords)
Section titled “Chart for a specific date (for all countries and keywords)”The chart shows the distribution of keywords by search positions in the App Store for all keywords by country for a given date.
It also shows the number of keywords in each category and the change compared to the previous day.
- Top 1 - 1st position
- Top 5 - positions 2 to 5
- Top 10 - positions 6 to 10
- Top 20 - positions 11 to 20
- Top 50 - positions 21 to 50
- Top 100 - positions 51 to 100
- Total number of keywords
History for the last 30 days for the Indie membership
For the Pro and Marketing memberships without date restrictions

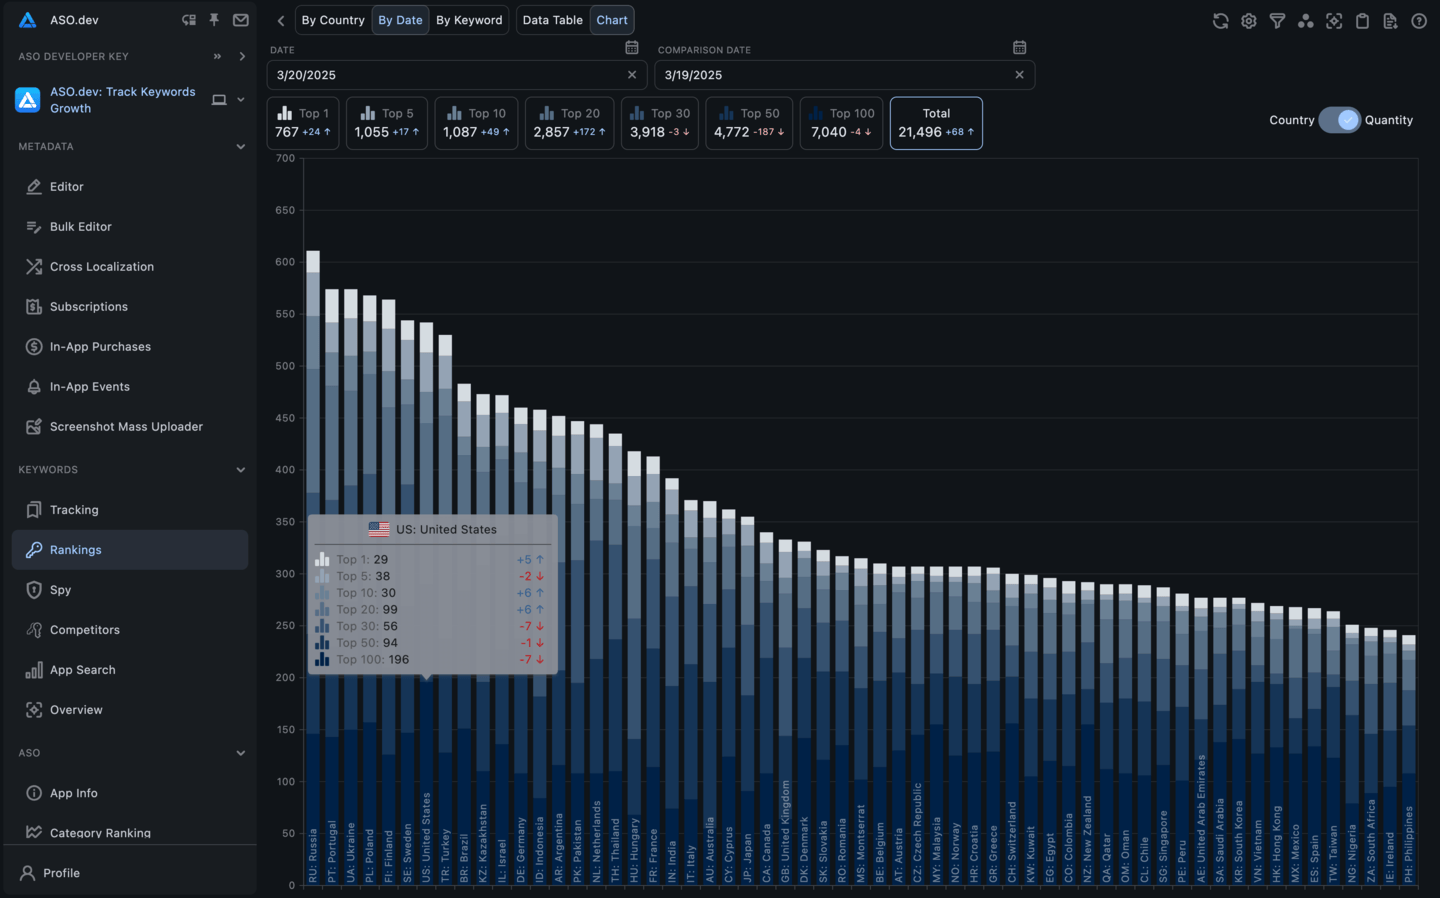

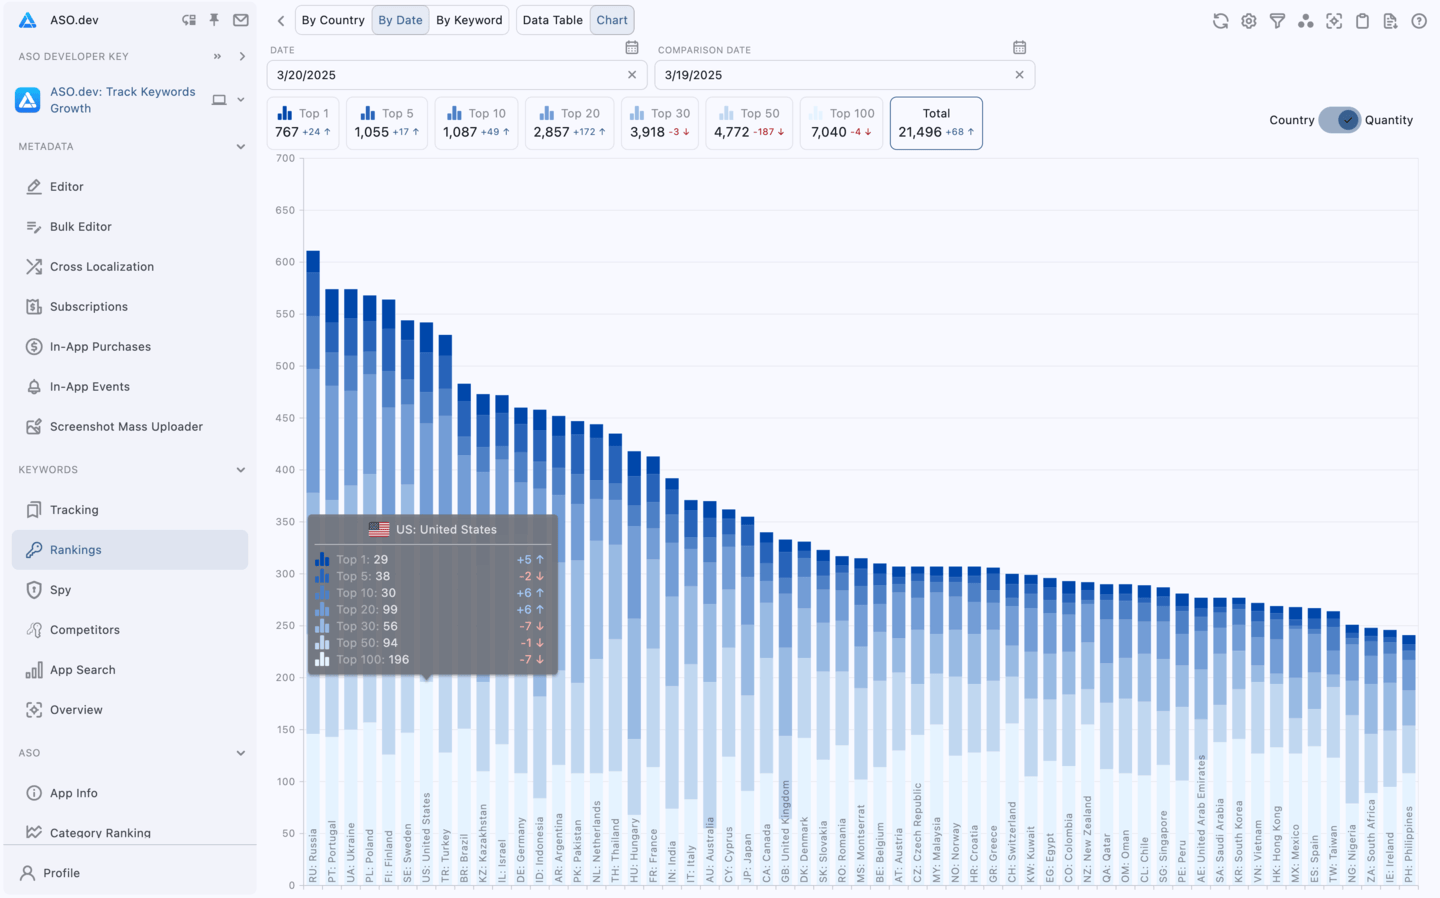
Table by keyword (for all countries and dates)
Section titled “Table by keyword (for all countries and dates)”In this view, the table shows columns representing dates and rows representing countries.
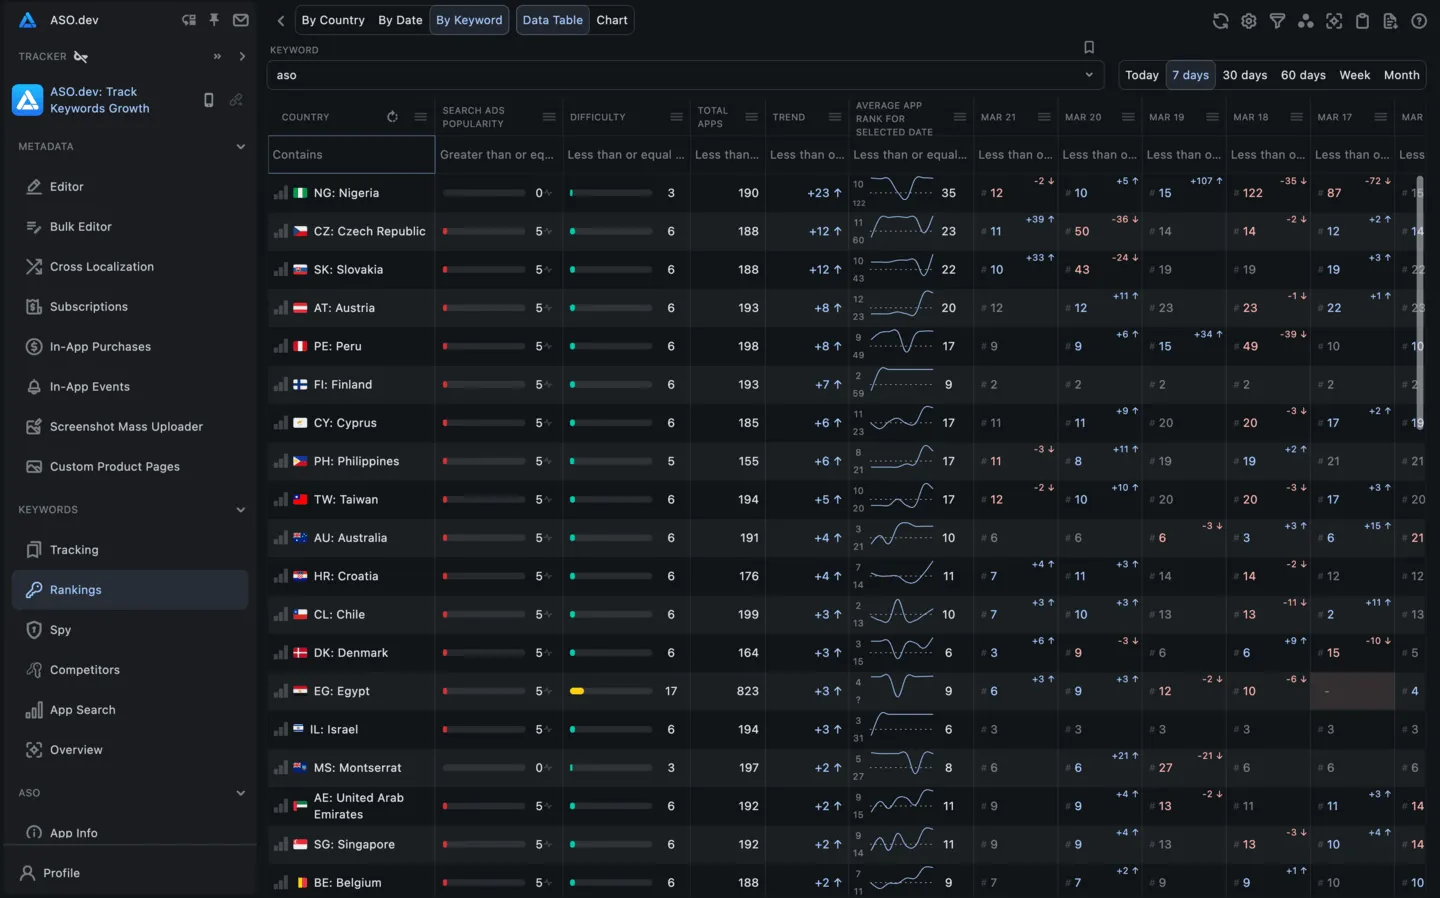
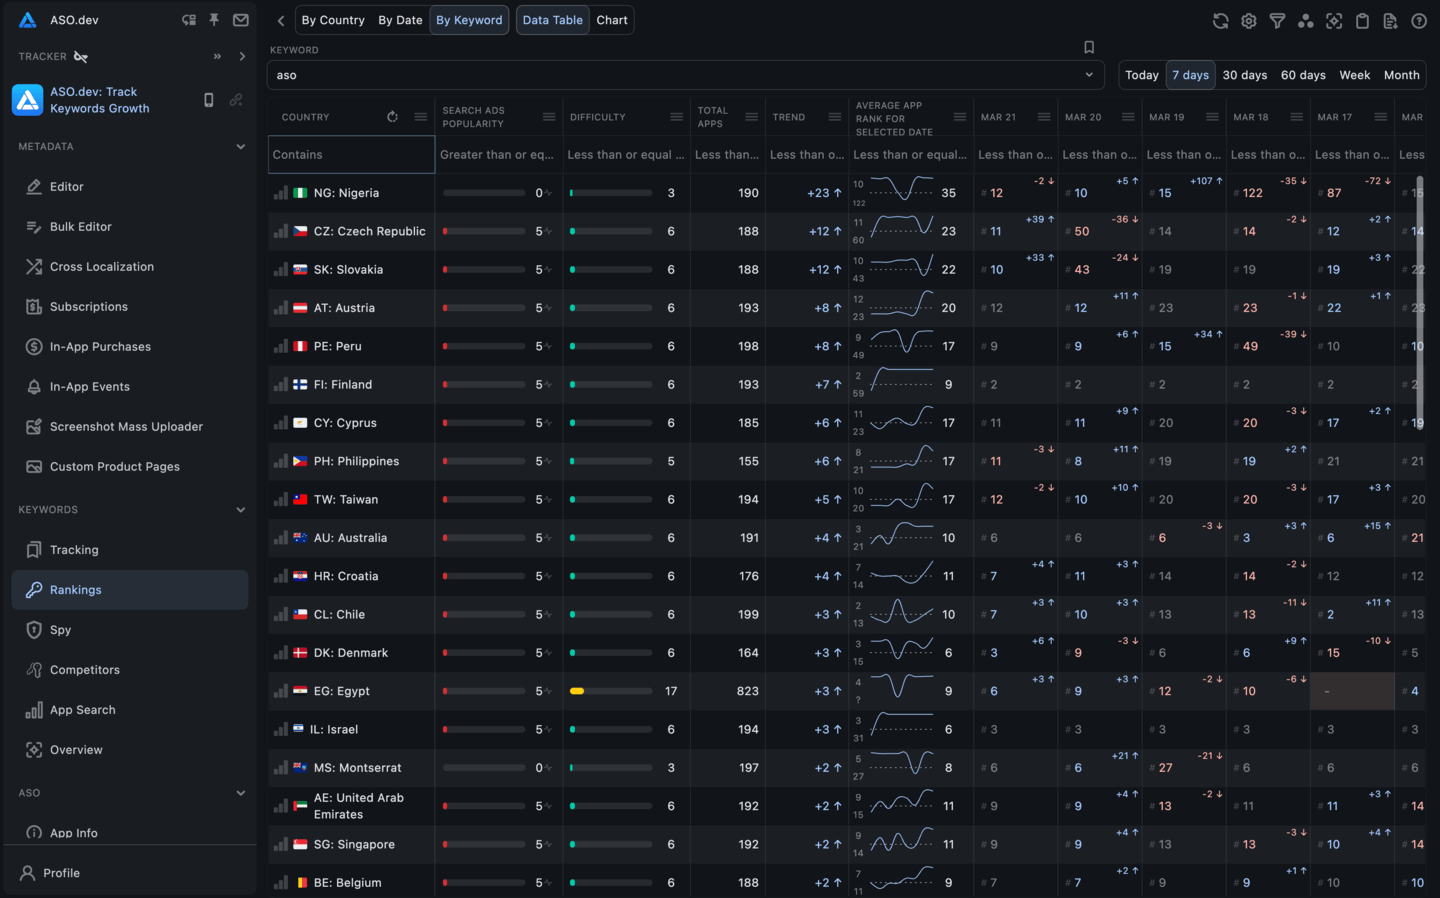
You can also rotate it so that the columns display countries, and the rows show dates.
This view allows users to evaluate keyword performance on different dates for a specific country or vice versa.
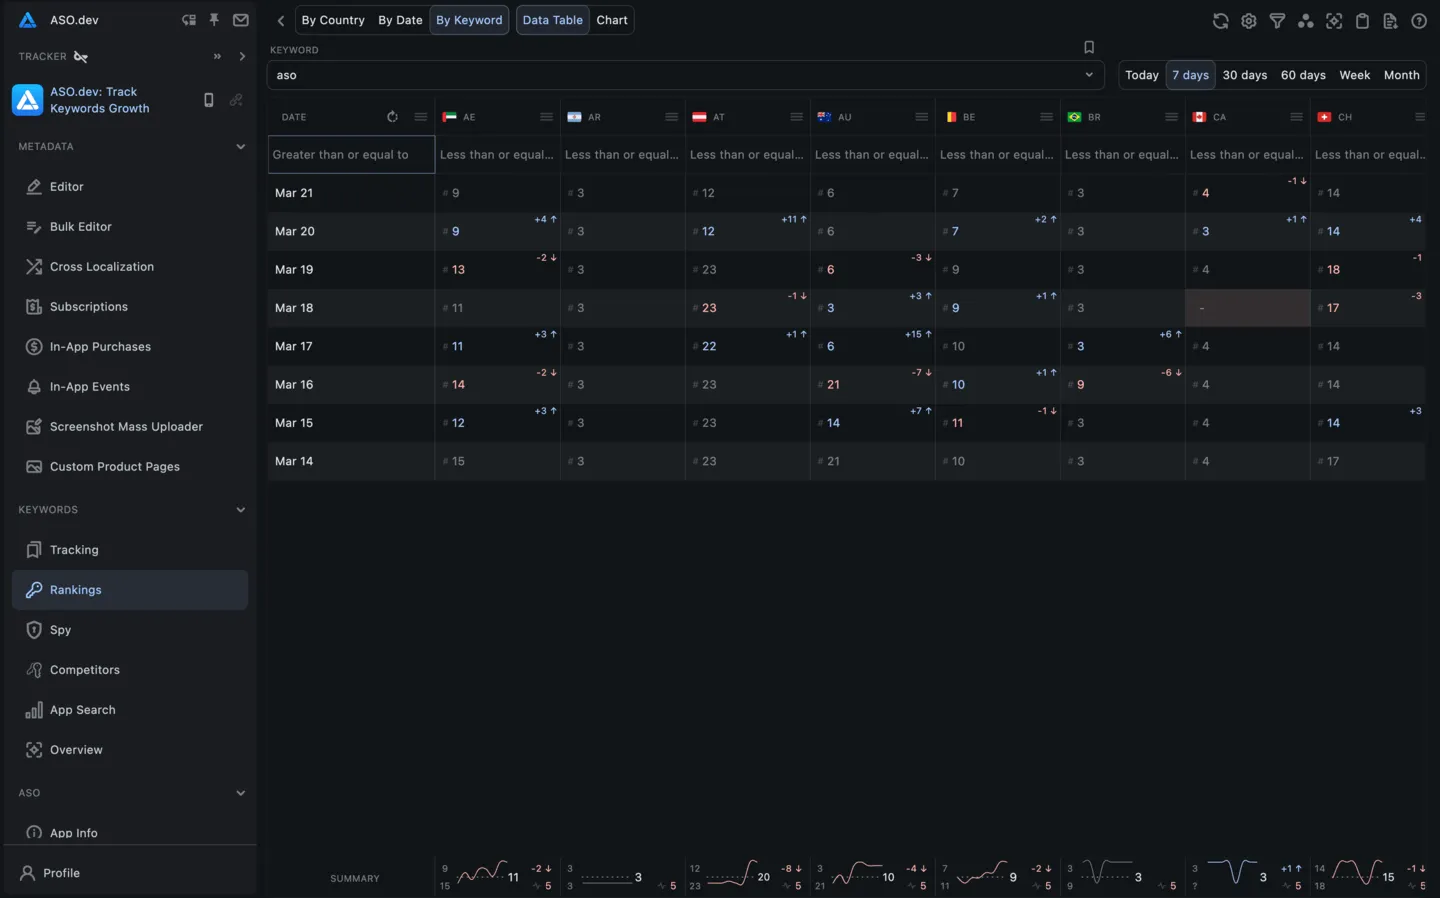
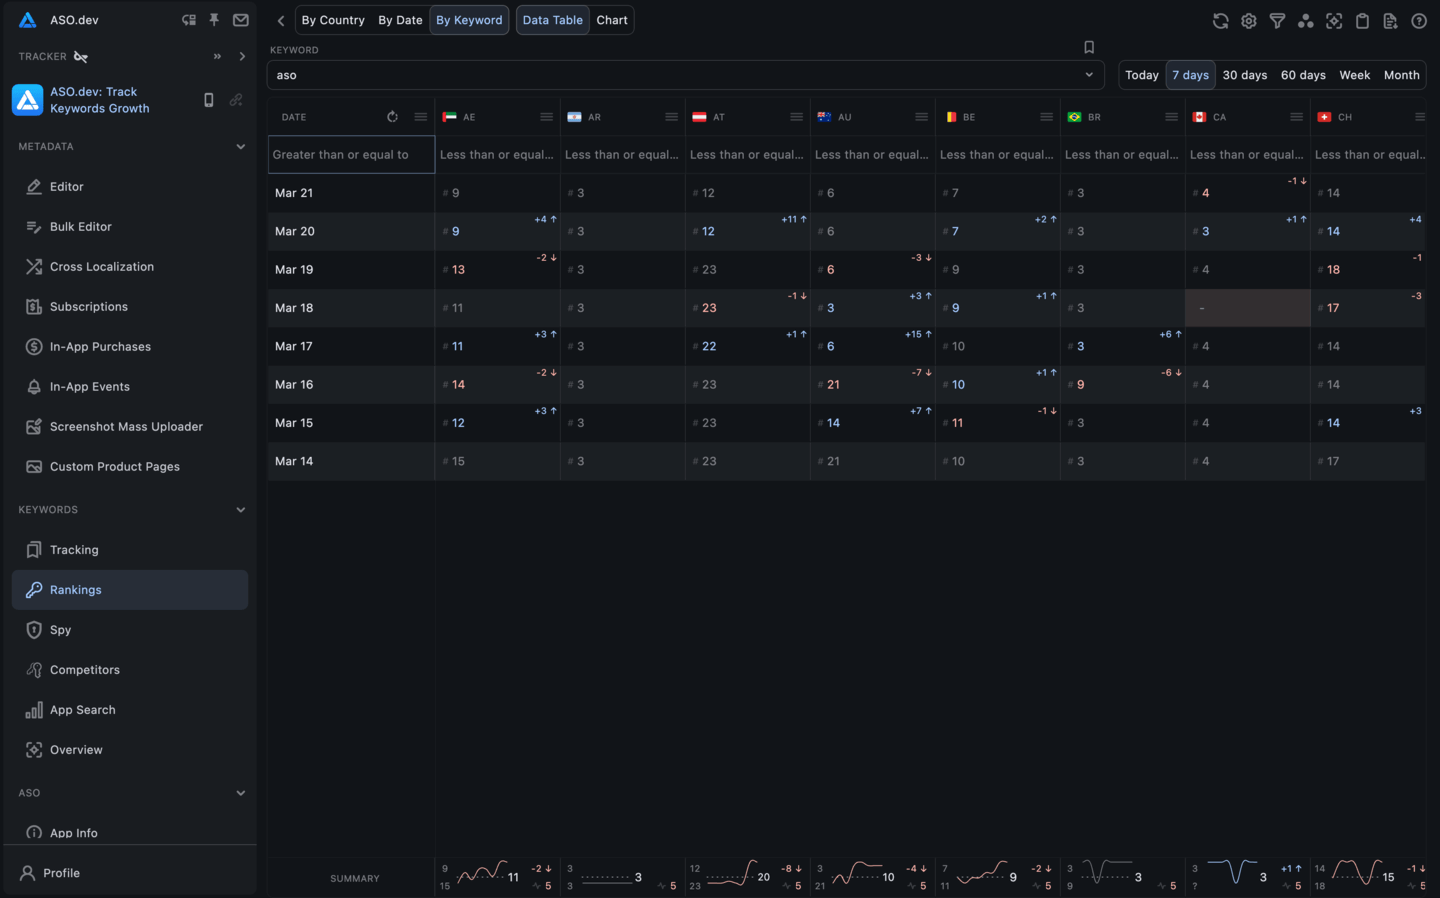
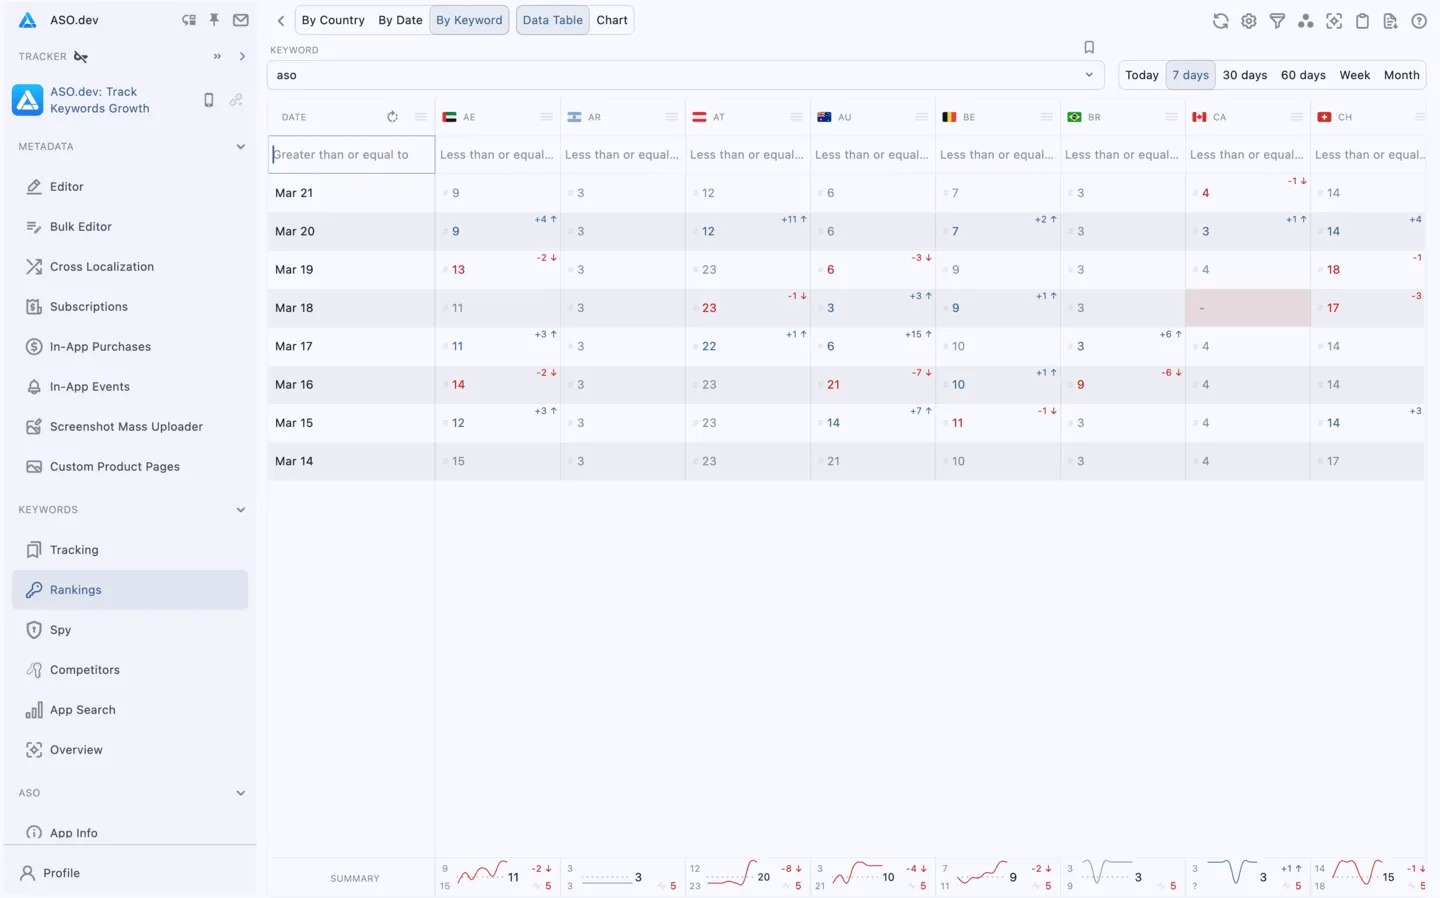
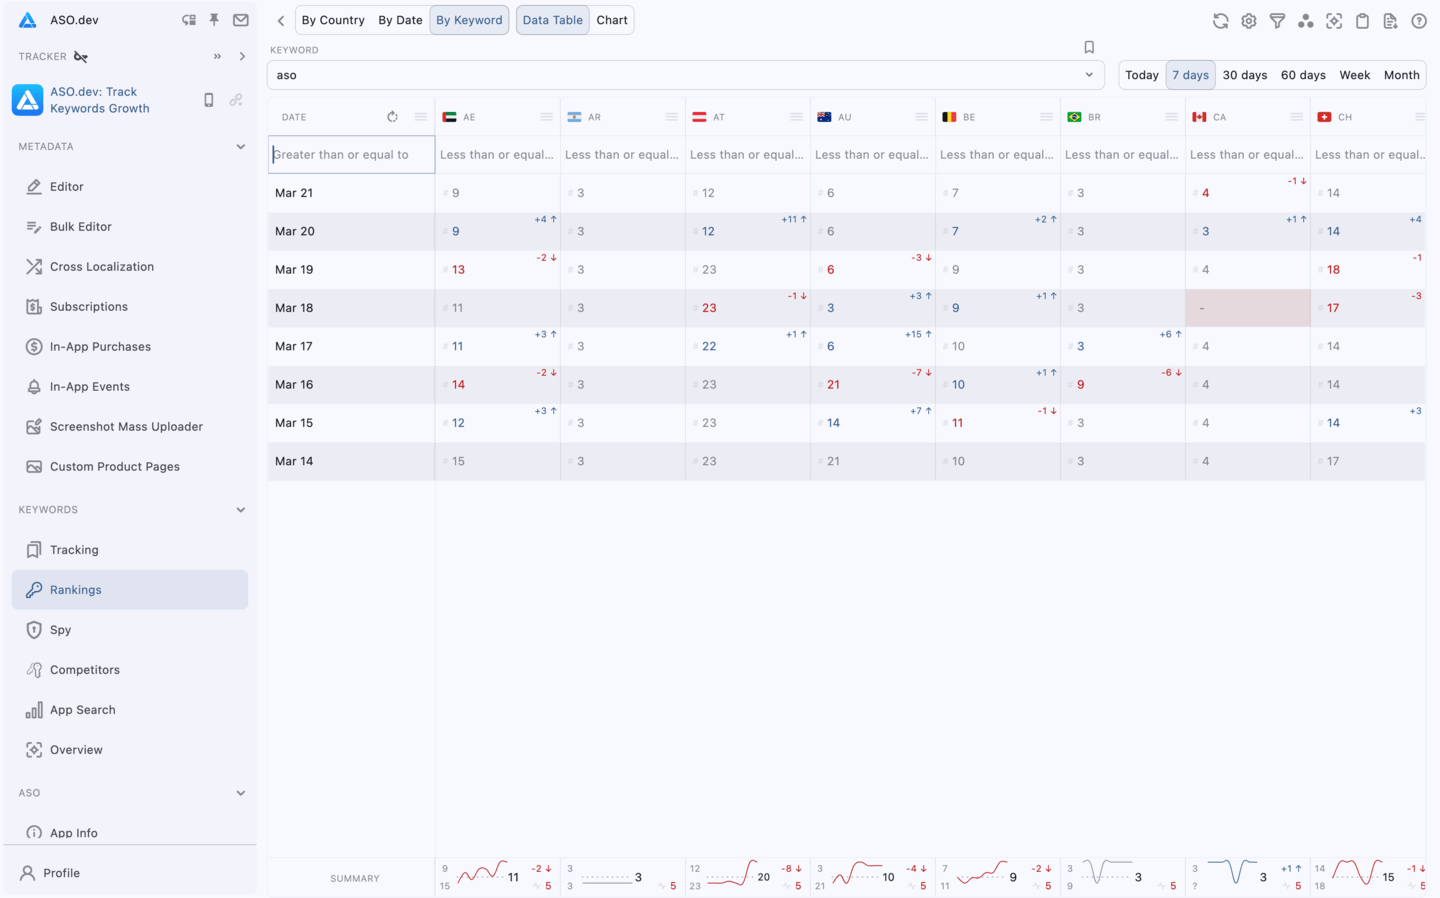
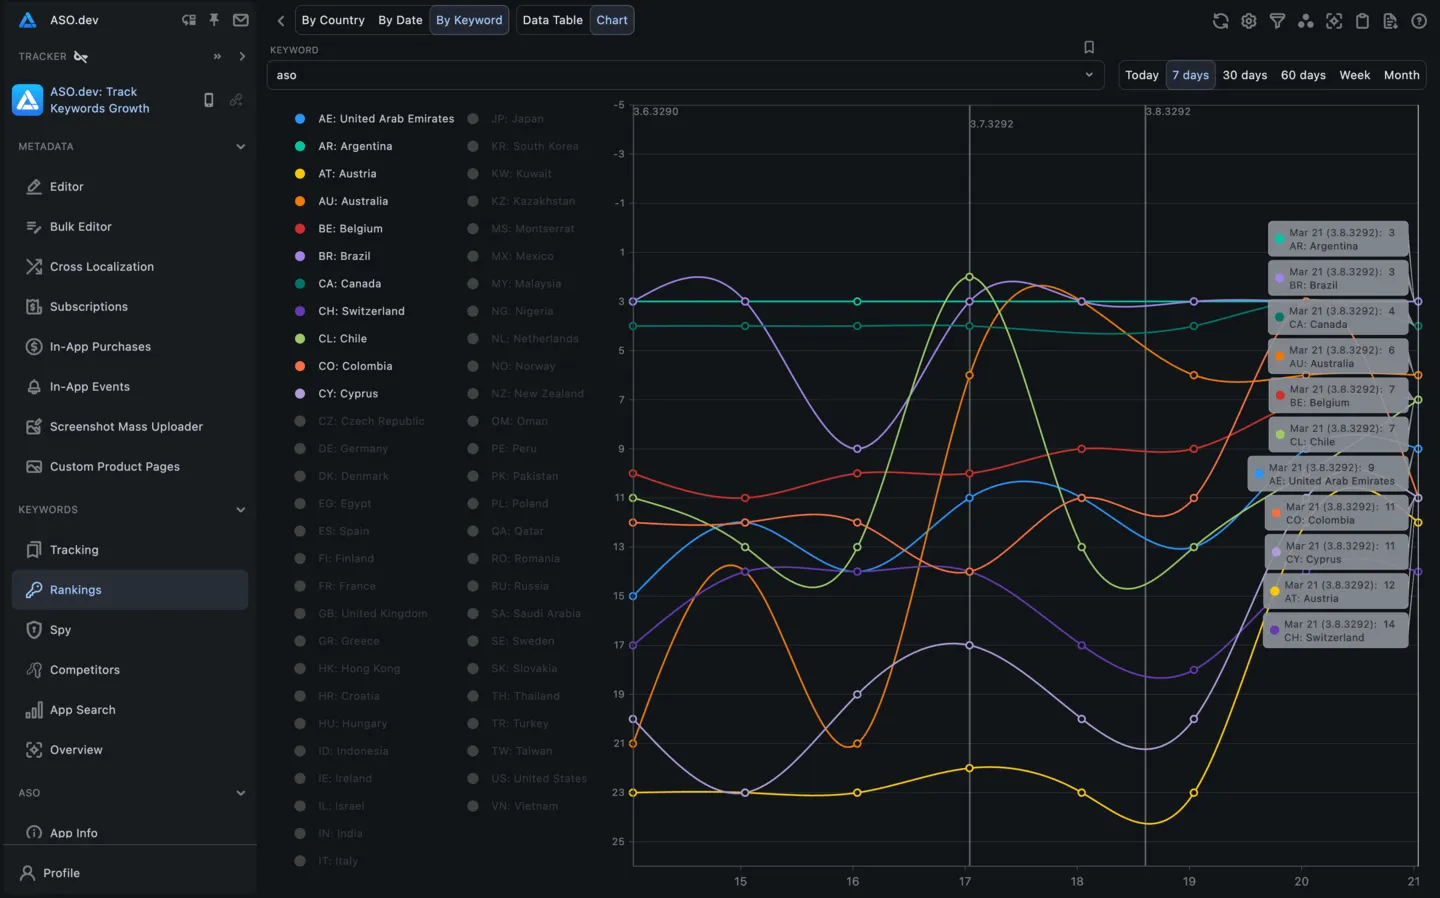
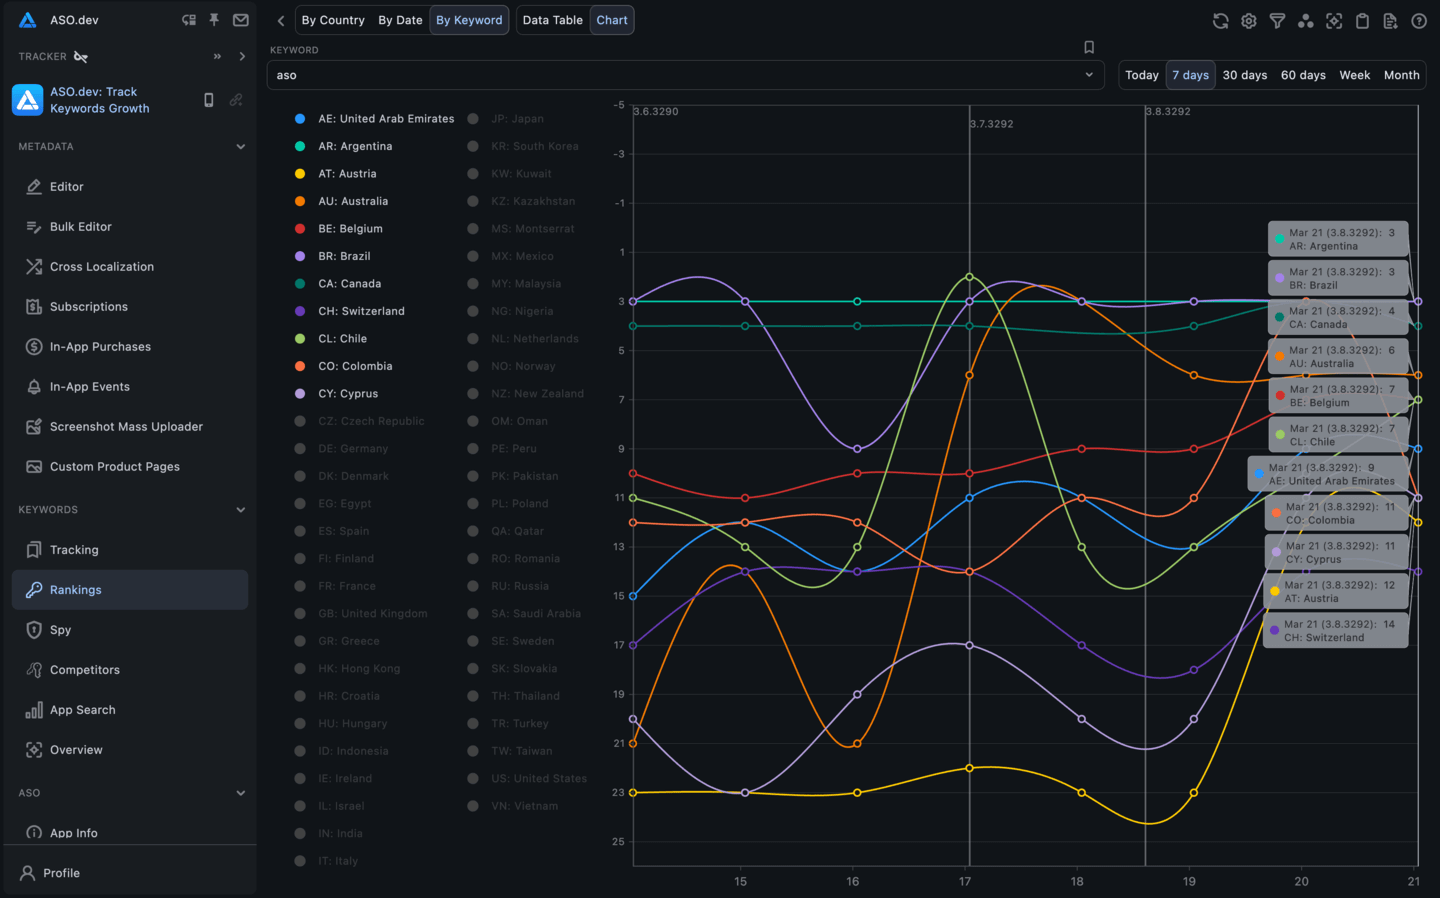
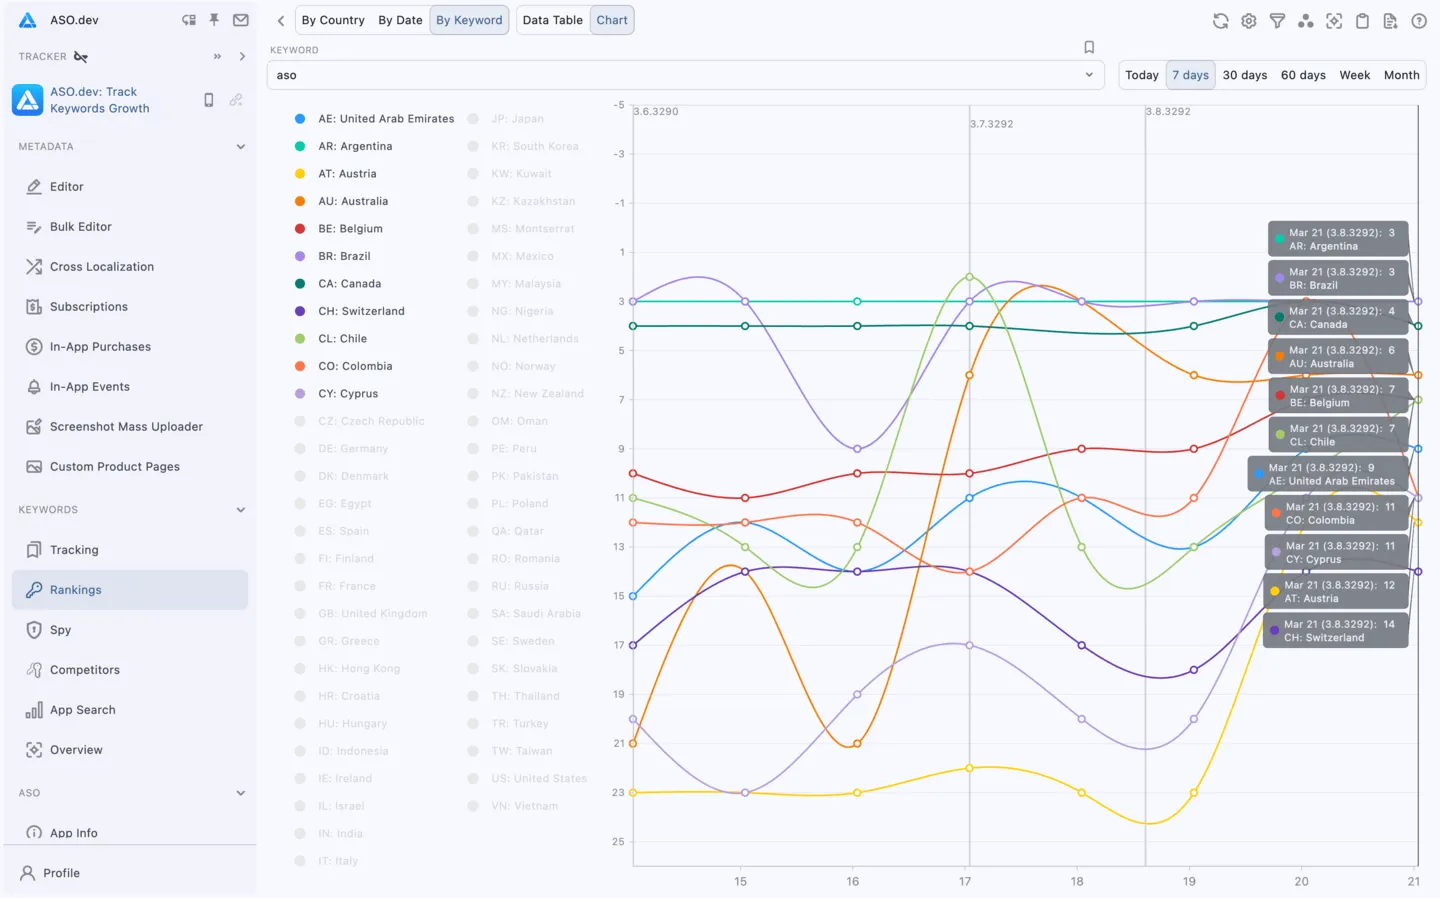
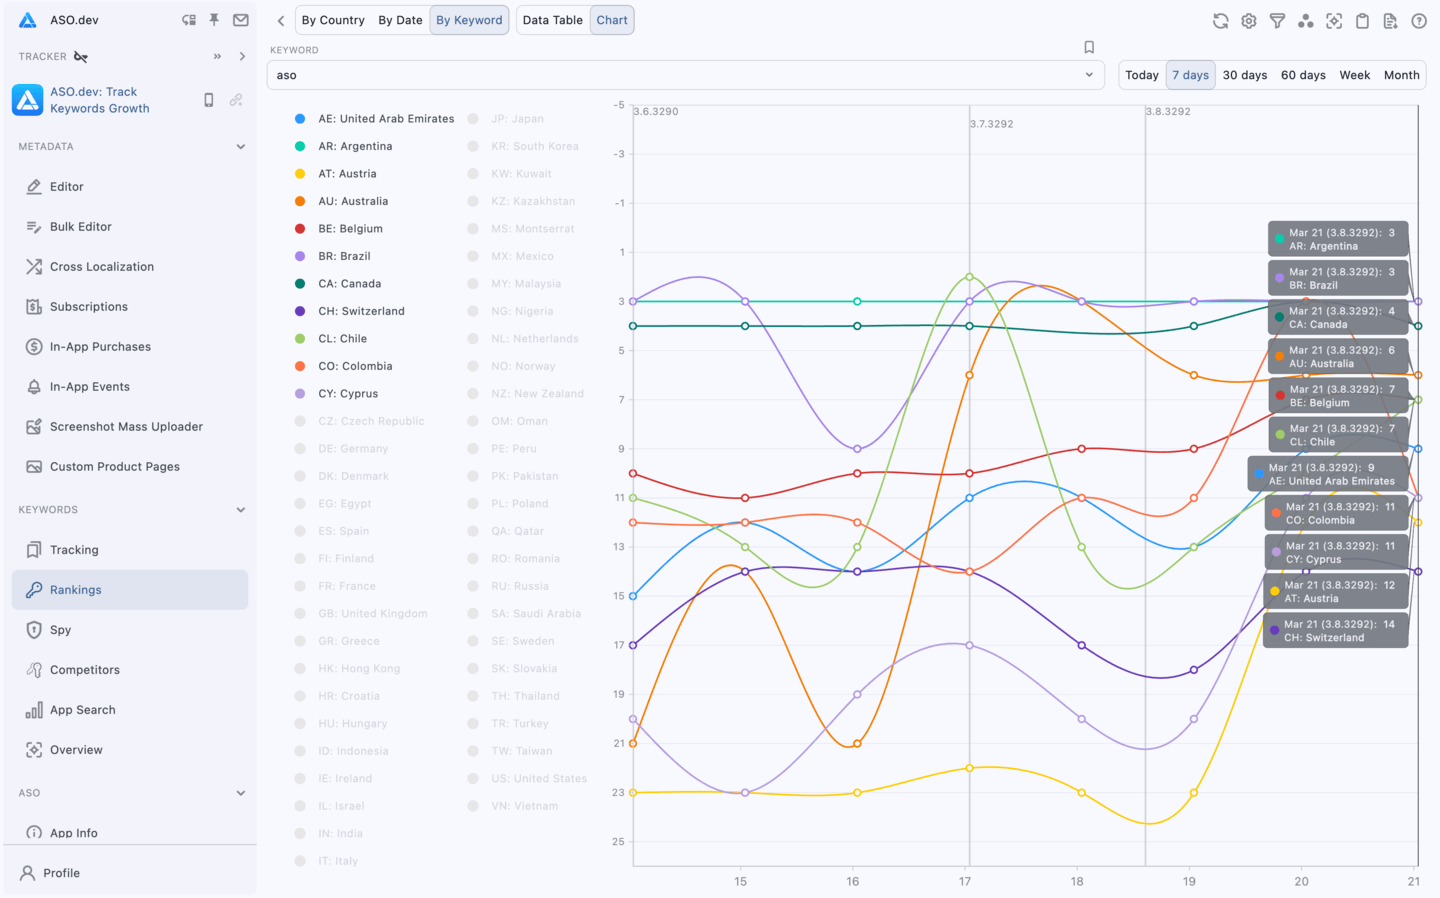
Chart by keyword (for all countries and dates)
Section titled “Chart by keyword (for all countries and dates)”The chart shows changes in keyword rankings for several countries over time.
This allows you to compare how keywords performed in different countries and how their effectiveness changed over time.
Each line on the chart shows how the ranking of a keyword changed in a specific country over time.
How it works
Section titled “How it works”Row selection and bulk actions
Section titled “Row selection and bulk actions”In each keywords table, you can select one or multiple rows using the checkboxes on the left side of each row.
This allows you to perform bulk actions with the selected keywords, such as exporting selected rows to Excel, adding selected keywords to your project’s Keywords Tracking List, or removing them.
This greatly simplifies the handling of large datasets.
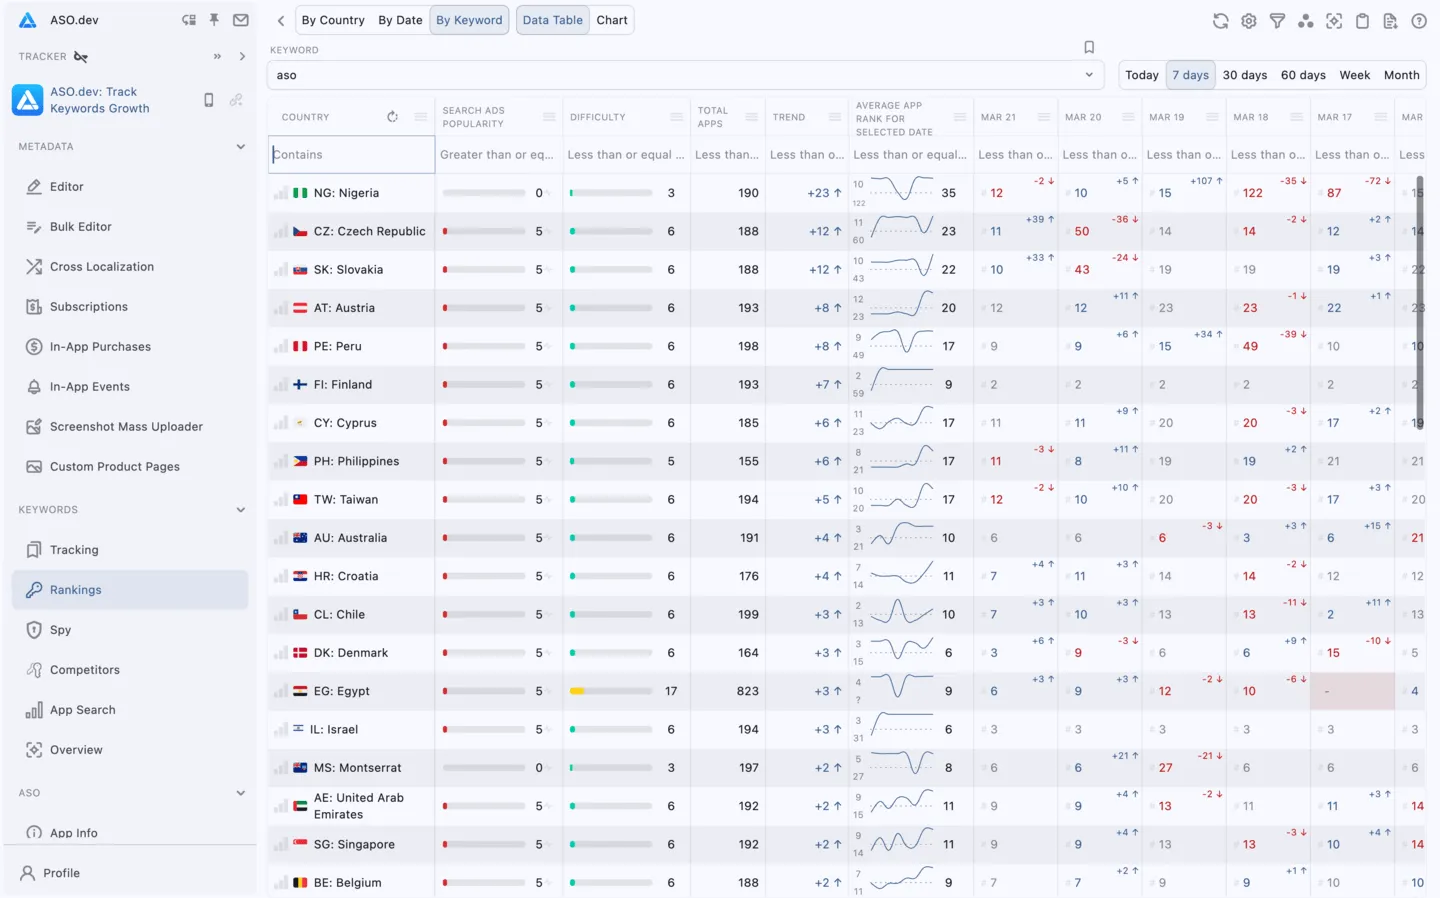
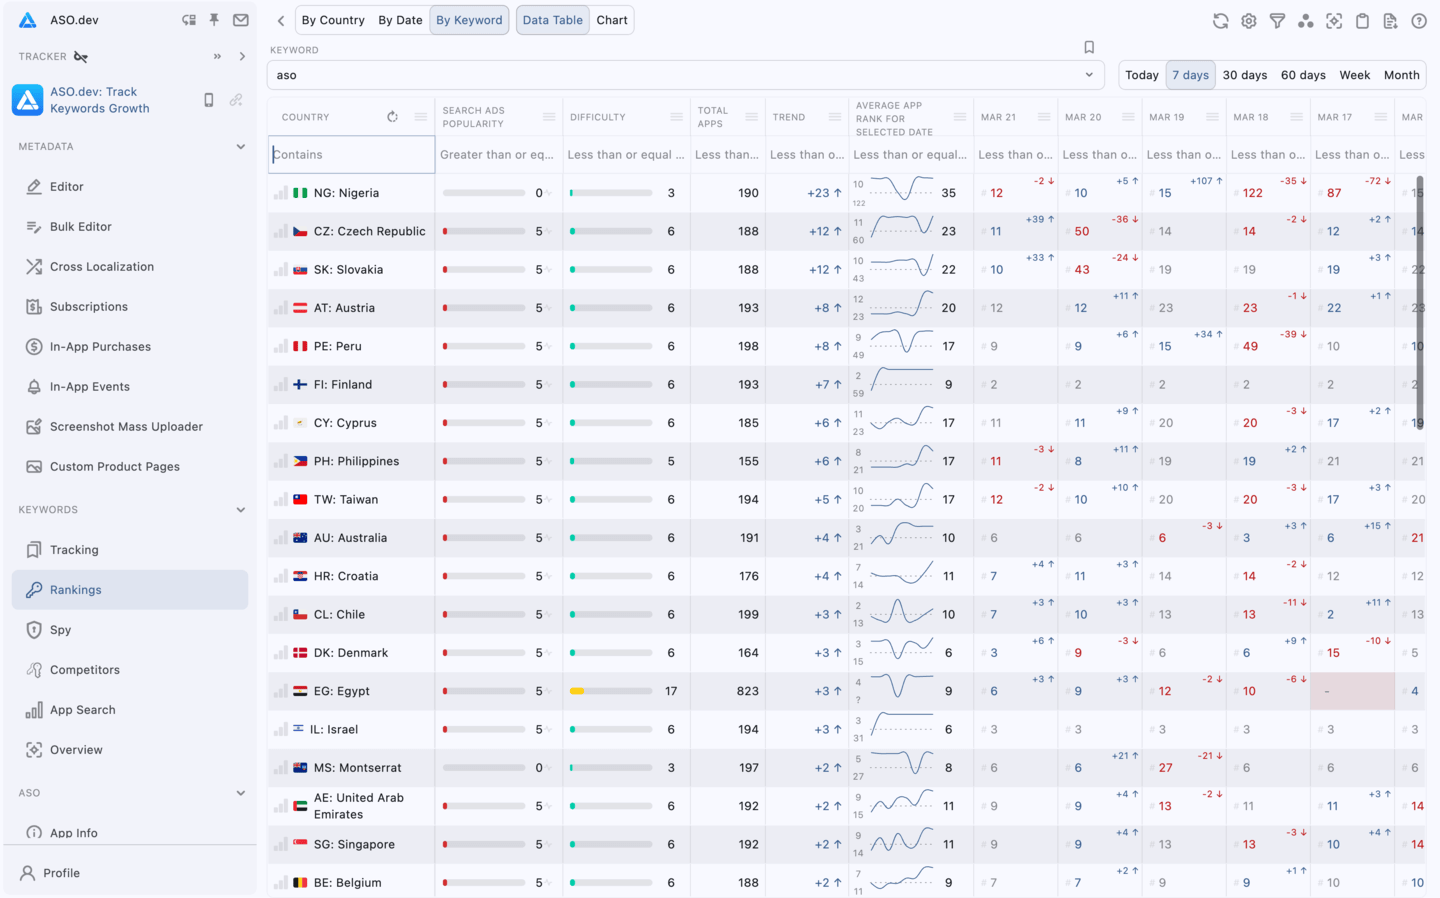
Search and filter
Section titled “Search and filter”ASO.dev provides the ability to search and filter data by various parameters such as ranking, difficulty, popularity, and the number of apps.
Filters and sorting options are located in the header of each column.
You can resize the columns, rearrange them, or hide them for more convenient work.