App Flow: App Store Trends & Daily Release Stats
The App Flow section in ASO.dev provides a visual analysis of changes in the number of apps in the App Store over a selected period.
This tool allows you to track the total number of apps, as well as daily fluctuations - how many new apps were added and how many were removed.

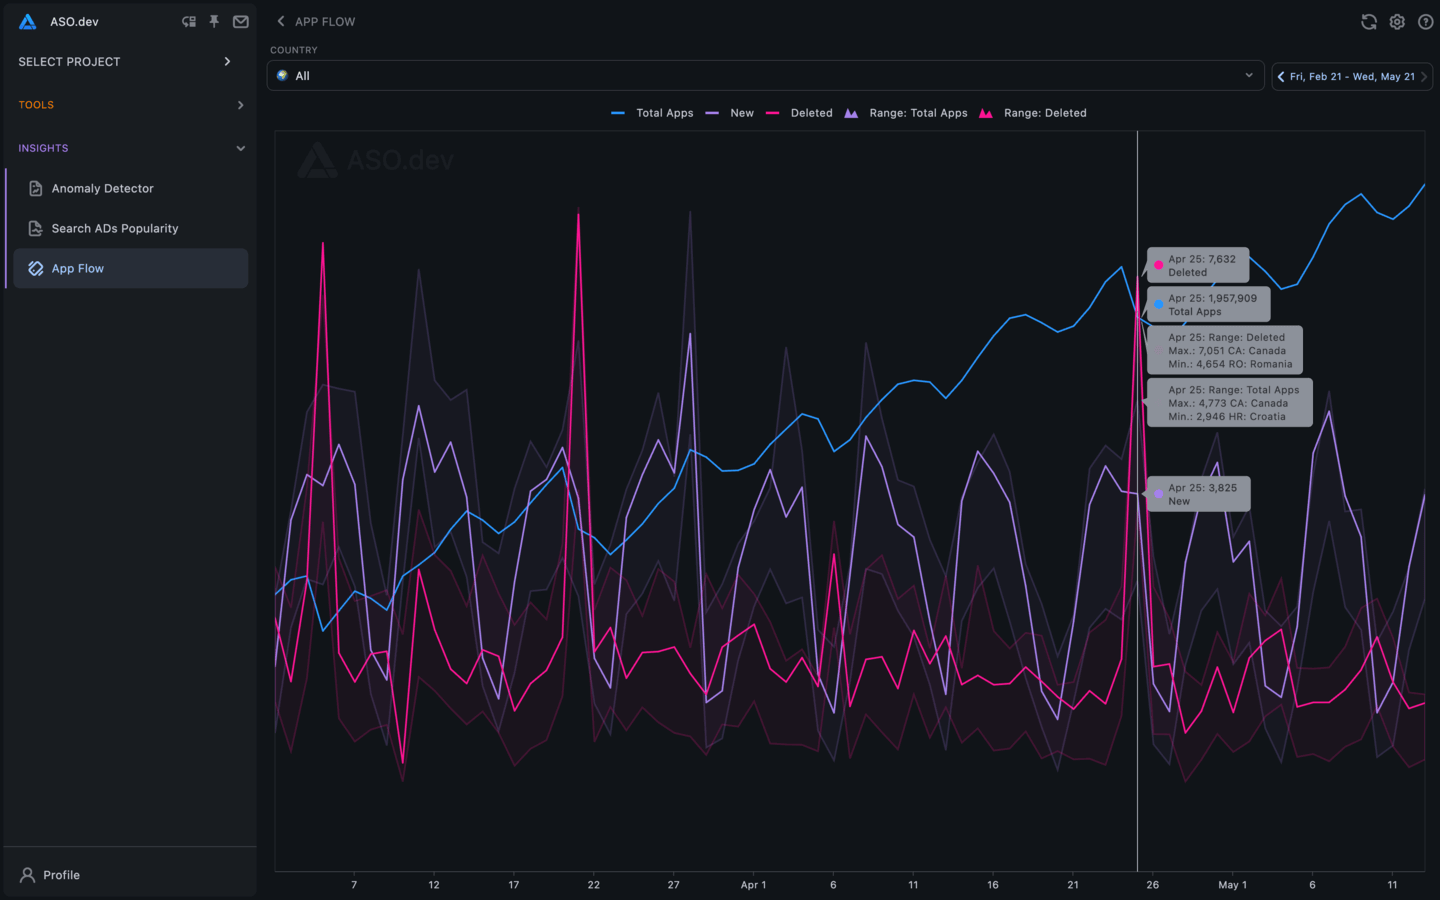
You can select a specific country for a detailed analysis of app dynamics by region.
A date range selection is also available, allowing you to track changes over a specific period and identify seasonal or short-term trends.
Key Features:
Section titled “Key Features:”- Total number of apps
Blue line shows the total number of apps available in the App Store each day. - New apps
Violet line displays the number of new apps published in the store during the day. - Removed apps
Pink line shows how many apps were removed on that day. - Ranges - show minimum and maximum values by country to better understand regional differences.
- Pink range shows the difference in the number of apps removed during the day.
- Violet range - the difference in the number of new apps by country.
Benefits
Section titled “Benefits”You can select a specific country or analyze global data.
Easily identify peaks and trends - for example, mass removals or surges in new publications.
Ideal for analyzing market activity and preparing for strategic changes (releases, competition, publication trends).
Viewing Apps
Section titled “Viewing Apps”To view the list of apps in the App Store that were added or removed on a specific day, use the Index Changes section in ASO.dev.